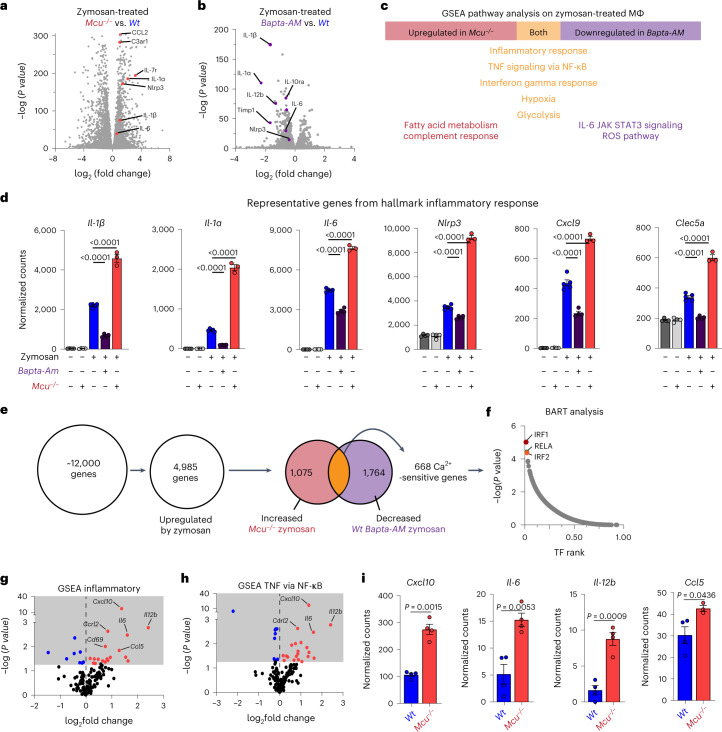
Fig. 7. RNA-seq analysis of Mcu−/− and BAPTA-AM-loaded BMDMs reveals transcripts sensitive to mCa2+ uptake.
a, Volcano plot showing increased expression of inflammatory genes in Mcu−/− BMDMs, compared to WT BMDMs, treated with zymosan for 3 h. Data normalization, dispersion estimates and model fitting (negative binomial) were carried out with the DESeq function (DESeq2 R package). Wald statistics were used for the significance tests. b, Volcano plot showing reduced expression of inflammatory genes in BAPTA-AM loaded BMDMs, when compared to unloaded BMDMs, treated with zymosan for 3 h. Data normalization, dispersion estimates and model fitting (negative binomial) were carried out with DESeq. Wald statistics were used for the significance tests. c, GSEA pathway analysis of Mcu−/−, BAPTA-AM loaded (WT) and unloaded WT BMDMs stimulated with zymosan for 3 h. MΦ, macrophage. d, Normalized counts for representative genes in the GSEA hallmark inflammatory response pathway. N = 3–5 biological replicates. Error bars represent the s.e.m.; P values were determined by one-way ANOVA. e, Schematic showing gene transcripts used for BART analysis. f, BART analysis of 668 mCa2+-sensitive genes identified in a. Transcription factor (TF) rank was plotted against the −log(P value) for each identified transcription factor. g, Volcano plot showing gene expression of the GSEA inflammatory response pathway in unstimulated Mcu−/− macrophages, compared to their WT counterparts. Data normalization, dispersion estimates and model fitting (negative binomial) were carried out with DESeq. Wald statistics were used for the significance tests. h, Volcano plot showing expression of genes of the GSEA TNF–NF-κB pathway in unstimulated Mcu−/− macrophages, compared to their WT counterparts. Data normalization, dispersion estimates and model fitting (negative binomial) were carried out with DESeq. Wald statistics were used for the significance tests. i, Normalized counts for representative genes in the GSEA hallmark inflammatory response pathway. N = 4 biological replicates. Error bars represent the s.e.m.; P value was determined by Welch’s t-test, two-tailed.

