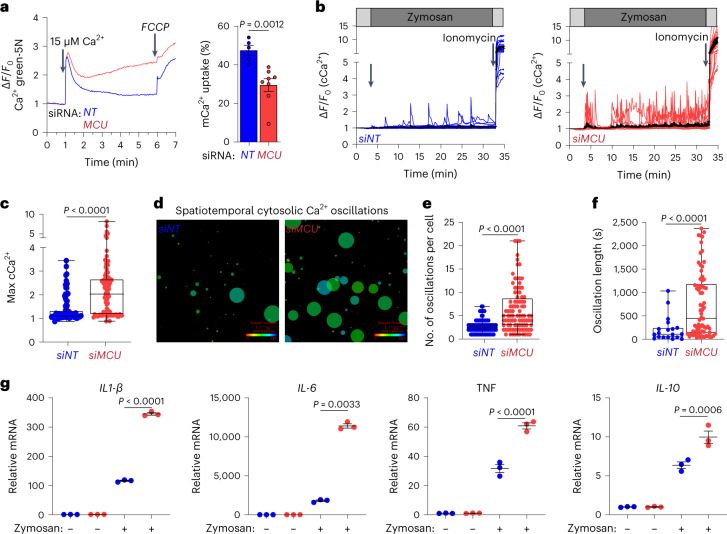
Fig. 8. siRNA-mediated depletion of MCU in human monocyte-derived macrophages renders them hyper-sensitive to inflammatory stimuli.
a, Representative trace for a mCa2+ uptake in permeabilized siNT and siMCU-transfected HMDMs. Right, quantification of mCa2+ uptake. N = 5–8 biological replicates. Error bars represent the s.e.m.; P = 0.0012 determined by t-test. b, cCa2+ oscillations in siNT and siMCU-transfected HMDMs. ΔF/F0 values for Fura-2-AM loaded macrophages were plotted. Images were taken every 3 s. c, Maximum cCa2+. N = 88–98 cells, three independent experiments. Whiskers represent the minimum to maximum values for each dataset. The box represents the 75th and 25th percentiles. The line is the median; P < 0.0001 according to Welch’s t-test, two-tailed. d, CALIMA maps depicting spatiotemporal aspects of cCa2+ elevations. e, Oscillation frequency was determined for individual cells. N = 88–98 cells, three independent experiments. Whiskers represent the minimum to maximum values for each dataset. The box represents the 75th and 25th percentiles. The line is at the median; P < 0.0001 according to Welch’s t-test, two-tailed. f, Oscillation length was determined for individual cells. N = 88–98 cells, three independent experiments. Whiskers represent the minimum to maximum values for each dataset. The box represents the 75th and 25th percentiles. The line is the median; P < 0.0001 according to Welch’s t-test, two-tailed. g, Gene expression of IL-1β, IL-6, TNF and IL-10 mRNA. N = 3 biological replicates. Error bars represent the s.e.m.; P values were determined by one-way ANOVA.

