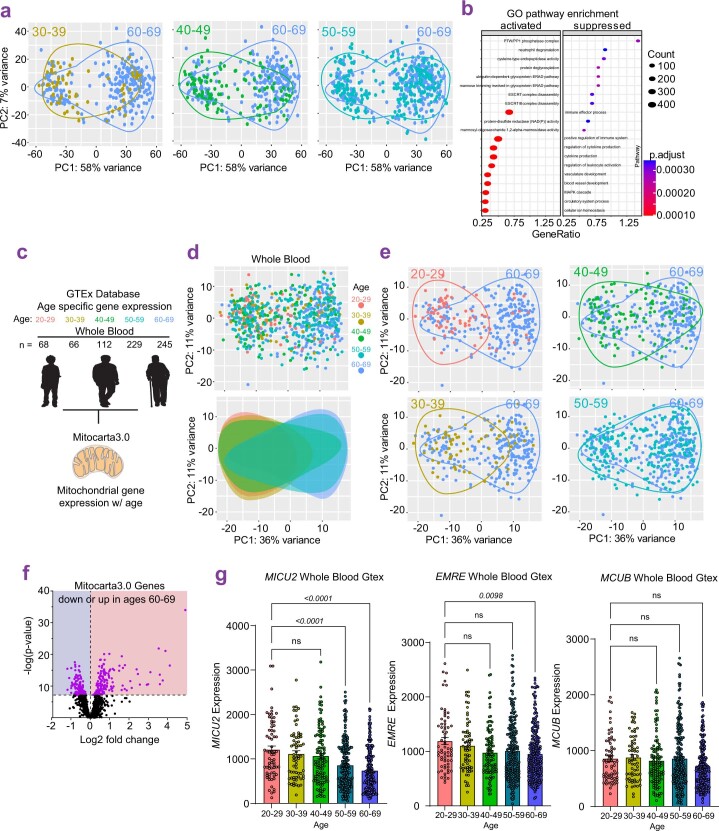
Extended Data Fig. 1. GTEx analysis of human whole blood transcriptomes.
a. Variance in gene expression in whole blood of different age groups based on Principal Component analysis on GTEx samples. b. GO pathway enrichment analysis based on DSeq2 from GTEx samples. Differential gene expression is plotted for ages 60–69 vs 20–29. Significance determined by Dotplot function (clusterProfiler R package1). c. Pipeline used for the analysis of genes encoding for mitochondria-localized proteins (mito-genes). d. Principal component analysis on mito-genes from GTEx samples. Variance in gene expression is shown for individual age groups. e. Variance in gene expression shown for age 20–29 vs 60–69, 30–39 vs 60–69, 40–49 vs 60–69, and 50–59 vs 60–69. f. Volcano plot of mito-genes expression levels in old (60–69y) vs young (20–29y) samples. Data normalization, dispersion estimates, and model fitting (negative binomial) were carried out with the DESeq function (DESeq2 R package). Wald statistics were used for the significance tests. g. MICU2, EMRE, and MCUB gene counts for each sample in GTEx database sorted by age. Error bars reflect SEM; p-values were calculated using one-way ANOVA.

