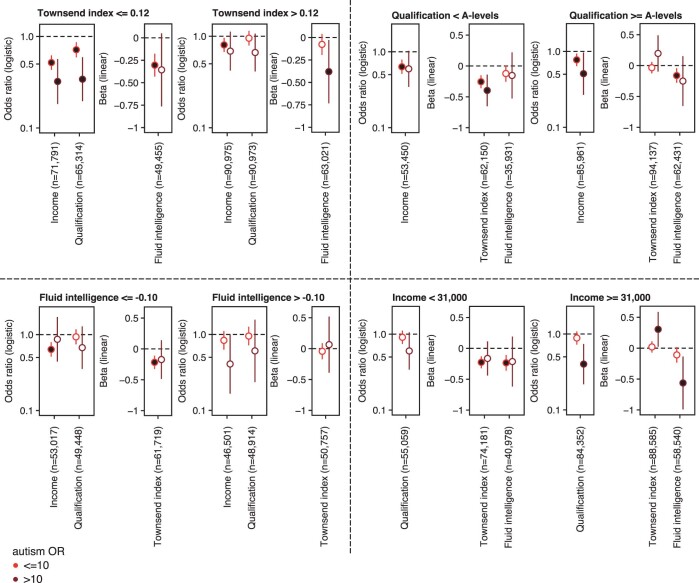
Extended Data Fig. 8. Regression results for socioeconomic and cognitive traits in different socioeconomic and cognitive strata.
Odds ratio (logistic regressions) and standardized beta values (linear regressions) associated to variant presence and autism PGS from multivariable regression analyses of socioeconomic traits and fluid intelligence, stratified by gene type and autism OR of genes carrying the variants, alternatively focusing on individuals within low and high range of values for each feature (Methods). For the Townsend index and fluid intelligence, the median of the distribution of values among S-LoF carriers was used to split the dataset (respectively z-scored reversed Townsend index of 0. 12092671 and fluid intelligence score of −0.10951938). For income, we chose to split individuals below and above £31,000, and for qualification below and above A levels or equivalent. This procedure allowed to split individual carrying S-LoFs into two partitions of approximately the same size. Error bars correspond to 95% confidence interval. Legend as in Fig. 5b.

