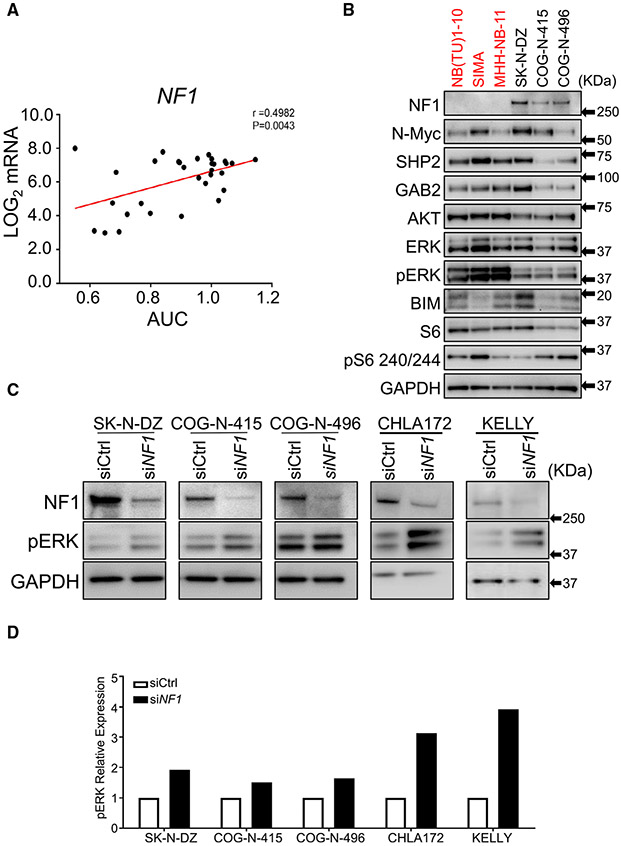
Figure 4. SHP099 sensitivity correlates with NF1 levels in neuroblastoma.
(A) Graph represents SHP099 sensitivity (area under the curve [AUC]) with respect to NF1 transcript levels obtained from R2 genomic (Sanger) database (http://hgserver1.amc.nl) in 31 available NB cells lines from the HTS. Pearson correlation analysis value: r = 0.4982; p = 0.0043.
(B) Immunoblot analysis of SHP099-sensitive (red) and SHP099-resistant (black) NB cell lines probed for NF1, SHP2, and other indicated antibodies. GAPDH was used as a loading control.
(C) Immunoblot analysis of NF1 and pERK expression in NF1-silenced NB cell lines insensitive to SHP099. Scrambled oligonucleotide was used as an siRNA control (siCtrl), and GAPDH was used as a loading control.
(D) Graph indicates relative levels of pERK in NF1-silenced NB cell lines quantified from (C).
See also Figures S8-S11.

