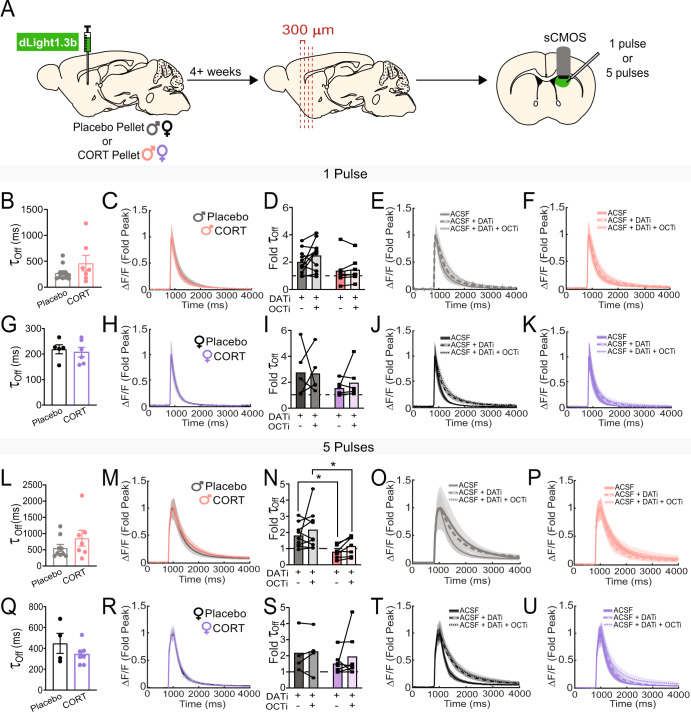
Fig. 3. Chronic corticosterone treatment impairs ex vivo dopamine transporter (DAT) function in the dorsomedial striatum (DMS) of male mice.
A Experimental timeline for viral injection, pellet implantation, and slice imaging experiments. B dLight1.3b fluorescence tau-off values after a single electrical stimulation of the DMS in acute tissue slices from male mice. C Average dLight1.3b fluorescence traces, normalized to the peak of dLight1.3b fluorescence. after a single electrical stimulation of the DMS in acute tissue slices from male mice. D Fold change of tau-off values of dLight1.3b fluorescence in the presence of inhibitors for the dopamine transporter (DATi) and organic cation transporter 3 (OCTi), normalized to tau-off values of dLight1.3b fluorescence in the absence of any transporter inhibitors, after a single electrical stimulation of the DMS in acute tissue slices from male mice. Two-Way ANOVA, trending effect of treatment p = 0.07. E, F Average dLight1.3b fluorescence traces, normalized to the peak of dLight1.3b fluorescence, after a single electrical stimulation of the DMS in acute slices from Placebo- (E) and CORT- (F) treated male mice, in the presence and absence of DATi and OCTi. G dLight1.3b fluorescence tau-off values after a single electrical stimulation of the DMS in acute tissue slices from female mice. H Average dLight1.3b fluorescence traces, normalized to the peak of dLight1.3b fluorescence, after a single electrical stimulation of the DMS in acute tissue slices from female mice. I Fold change of tau-off values of dLight1.3b fluorescence in the presence of DATi and OCTi, normalized to tau-off values of dLight1.3b fluorescence in the absence of any transporter inhibitors, after a single electrical stimulation of the DMS in acute tissue slices from female mice. J, K Average dLight1.3b fluorescence traces, normalized to the peak of dLight1.3b fluorescence, after a single electrical stimulation of the DMS in acute tissue slices from Placebo- (J) and CORT- (K) treated female mice, in the presence and absence of DATi and OCTi. L dLight1.3b fluorescence tau-off values after a 20 Hz, 5 pulse electrical stimulation of the DMS in acute tissue slices from male mice. M Average dLight1.3b fluorescence traces, normalized to the peak of dLight1.3b fluorescence, after a 20 Hz, 5 pulse electrical stimulation of the DMS in acute tissue slices from male mice. N Fold change of tau-off values of dLight1.3b fluorescence in the presence of DATi and OCTi, normalized to tau-off values of dLight1.3b fluorescence in the absence of any transporter inhibitors, after a 20 Hz, 5 pulse electrical stimulation of the DMS in acute tissue slices from male mice. Two-Way ANOVA, main effect of treatment p < 0.05, multiple comparisons *p < 0.05. O, P Average dLight1.3b fluorescence traces, normalized to the peak of dLight1.3b fluorescence, after a 20 Hz, 5 pulse electrical stimulation of the DMS in acute tissue slices from Placebo- (O) and CORT- (P) treated male mice, in the presence and absence of DATi and OCTi. Q dLight1.3b fluorescence tau-off values after a 20 Hz, 5 pulse electrical stimulation of the DMS in acute tissue slices from female mice. R Average dLight1.3b fluorescence traces, normalized to the peak of dLight1.3b fluorescence, after a 20 Hz, 5 pulse electrical stimulation of the DMS in acute tissue slices from female mice. S Fold change of tau-off values of dLight1.3b fluorescence in the presence of DATi and OCTi, normalized to tau-off values of dLight1.3b fluorescence in the absence of any transporter inhibitors, after a 20 Hz, 5 pulse electrical stimulation of the DMS in acute tissue slices from female mice. T, U Average dLight1.3b fluorescence traces, normalized to the peak of dLight1.3b fluorescence, after a 20 Hz, 5 pulse electrical stimulation of the DMS in acute tissue slices from Placebo- (T) and CORT- (U) treated female mice, in the presence and absence of DATi and OCTi. Points represent the average of 2–3 sweeps from a single individual. Data presented as mean ± SEM.

