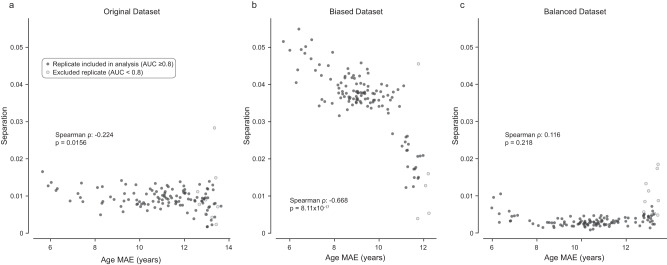
Fig. 4. Quantifying the systematic effect of age encoding on fairness.
In each panel, replicates are shown as individual points (n = 125), with age mean absolute error (MAE) on the x-axis and separation on the y-axis. Note that increasing values on the x-axis correspond to a reduction in age encoding; increasing values on the y-axis denote worsening fairness. Therefore, a correlation between encoding and unfairness would be observed as a negative correlation. a Original dataset. For this dataset, models which encoded age to a lesser degree (right) tended to be slightly more fair (lower separation), as reflected by a statistically significant Spearman rank correlation (two-sided). b The same analysis for the biased dataset. In this case, the correlation between age encoding and unfairness is markedly strengthened. c Balanced dataset. There was no significant correlation between age encoding and unfairness in this dataset. In all analyses, replicates with unacceptable performance (AUC < 0.8, arbitrary threshold) were excluded (open dots). Source data are provided as a Source Data file.

