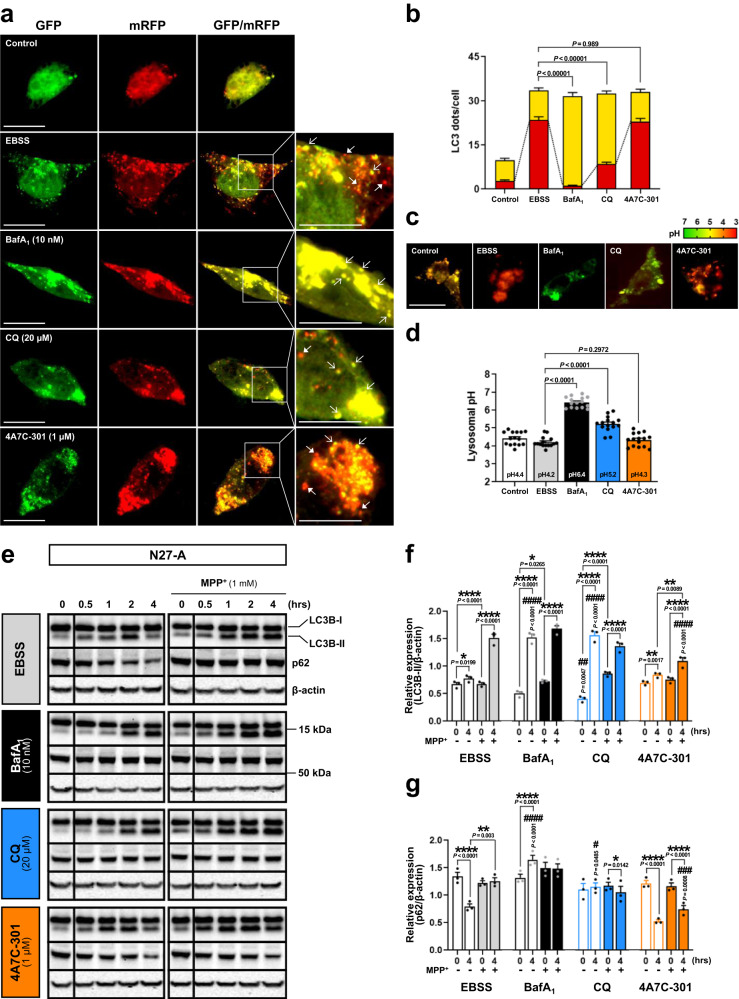
Fig. 3. CQ inhibits but 4A7C-301 protects autophagy.
a, b Autophagolysosome (APL) formation assay in N27-A cells. a Tandem mRFP-GFP-LC3 fluorescence images for APL detection. Scale bars, 20 µm. b Number of yellow LC3 dots and red LC3 dots per cell was counted from 10 random cells in each well from triplicates for each condition (total of 30 cells per each group). Two-tailed unpaired t test. Data are mean ± s.e.m. c, d Lysosomal pH detection in N27-A cells. c LysoSensor™ Yellow/Blue DND-160 fluorescence images. Scale bars, 20 µm. d Quantification from 5 random cells in each well from triplicates for each treatment group (total of 15 cells per each group). Two-tailed unpaired t test. Data are mean ± s.e.m. e–g Western blot analyses for autophagic flux in N27-A cells. Autophagic flux markers LC3B and p62 expressions (e) and quantitation of their expression levels (f, g). *P < 0.05, **P < 0.01, ****P < 0.0001; #P < 0.05, ##P < 0.01, ###P < 0.001, ####P < 0.0001 compared to EBSS, two-way ANOVA, Bonferroni’s multiple comparisons; n = 3 biologically independent samples per group. Data are mean ± s.e.m.

