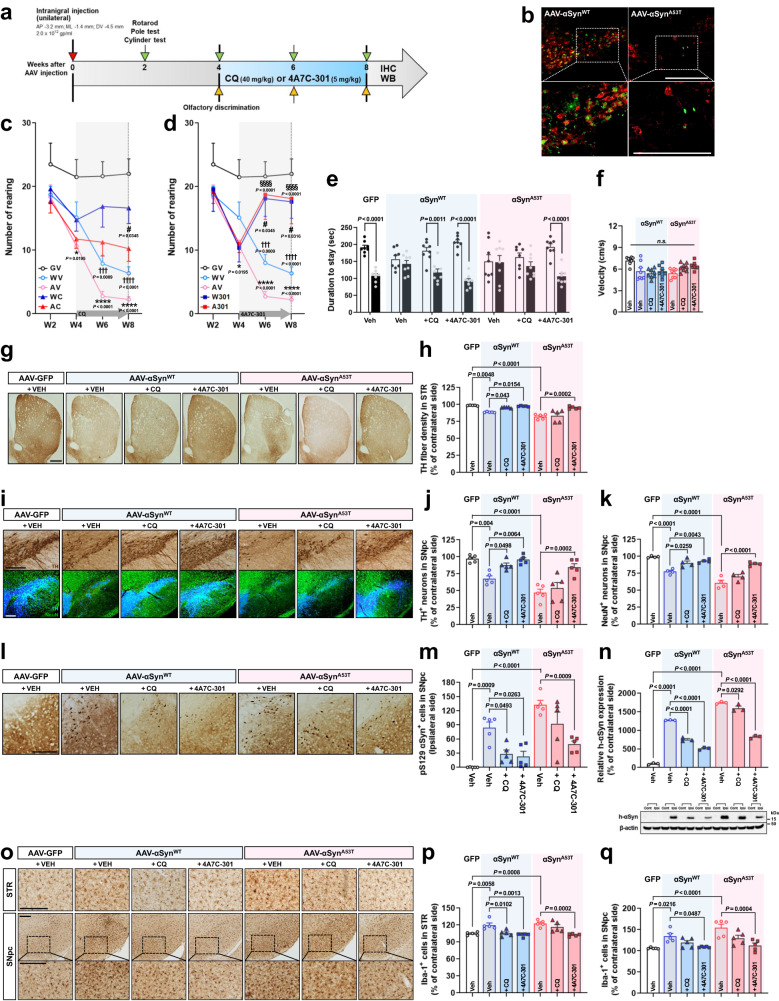
Fig. 5. 4A7C-301 exhibits robust neuroprotective effects on αSynWT- and αSynA53T-induced male mouse models.
a Schematic representation of CQ and 4A7C-301 administrations to AAV-αSyn-injected male mice. b Representative TH (red) and GFP (green) immunofluorescence images from two independent experiments in the SNpc of AAV-αSynWT- or -αSynA53T-injected mice. Scale bars, 500 µm. c, d Cylinder tests with CQ (c) or 4A7C-301 (d) treated group. †††P < 0.001, ††††P < 0.001 compared between GV and WV; *P < 0.05, ****P < 0.0001 compared between GV and AV; #P < 0.05 compared WV to WC or W301; §§§§P < 0.0001 compared AV to AC or A301. Two-way ANOVA, Tukey’s multiple comparisons; n = 8 per group. Data are mean ± s.e.m. GV, GFP + VEH; WV, αSynWT + VEH; AV, αSynA53T + VEH; WC, αSynWT + CQ; AC, αSynA53T + CQ; W301, αSynWT + 4A7C-301; A301, αSynA53T + 4A7C-301. e, f Olfactory discrimination test performed at 8 weeks after surgery. e Duration of stay between new and old bedding. Two-way ANOVA, Bonferroni’s multiple comparisons. Data are mean ± s.e.m. f Velocity during the session. n.s., not significant (P > 0.05), one-way ANOVA. Data are mean ± s.e.m. n = 8 per group. g, h Immunohistochemical analyses of TH+ neurons by densitometry in the STR. Scale bar, 500 µm. One-way ANOVA, Tukey’s post-hoc test; n = 5 per group. Data are mean ± s.e.m. i–k Immunohistochemical analyses of TH+ DA neurons (I, j) and NeuN+ neuros (I, k) in the SNpc. Scale bars, 500 µm.One-way ANOVA, Tukey’s post-hoc test; j, n = 5 per group; k, n = 4 per group. Data are mean ± s.e.m. l Representative pS129 immunohistochemistry in the SNpc. Scale bars, 250 µm. m, Quantification of pS129 αSyn+ cells by counting. One-way ANOVA, Tukey’s post-hoc test; n = 5 per group. Data are mean ± s.e.m. n Western blot analyses of human-αSyn in the SNpc of AAV-αSyn-injected mice. Values are expressed as a relative expression compared to contralateral side. One-way ANOVA, Tukey’s post-hoc test; n = 3 per group. Data are mean ± s.e.m. o–q Immunohistochemical analyses of Iba-1+ microglia by counting in the STR (p) and SNpc (q). One-way ANOVA, Tukey’s post-hoc test; n = 5 per group. Data are mean ± s.e.m. Scale bars, 250 µm.

