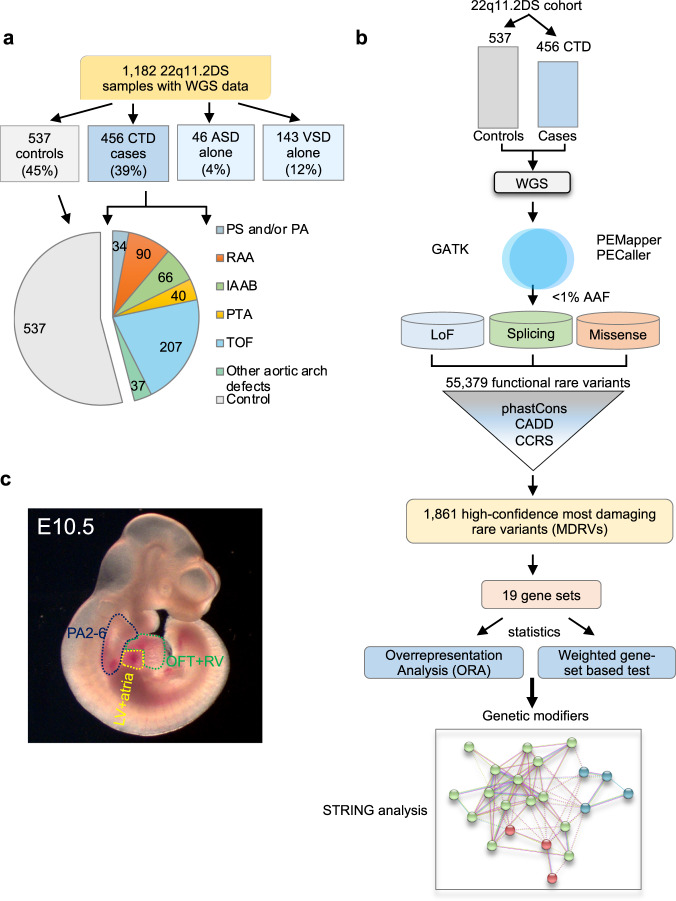
Fig. 1. The 22q11.2 deletion syndrome cohort and study design.
a Pie chart of intracardiac and aortic arch phenotypes. Control (gray, no significant heart defect); CTD (conotruncal heart defect, blue); ASD alone (isolated atrial septal defect but no other heart or aortic arch defects, light blue); VSD alone (isolated ventricular septal defect but no other heart or aortic arch defects, light blue). Pie chart includes controls (gray) versus CTD cases with phenotypes including: TOF (tetralogy of Fallot, light blue), RAA (right sided aortic arch, orange), IAAB (interrupted aortic arch type B, green), PTA (persistent truncus arteriosus, yellow), PS/PA (pulmonary stenosis and/or pulmonic atresia, blue) and other aortic arch defects such as abnormal origin of the right or left subclavian artery, alone (light green). b Schematic representation of the case-control study design using WGS. Variants were identified using PEMapper/Caller and validated by GATK. Only shared variants between both pipelines were used. Following quality control measures of the raw WGS data, variant annotation was performed to identify rare (< 1%) predicted LoF (loss of function), damaging splicing and damaging missense variants followed by filtering-based annotation on phastCons (conservation), CADD and CCRS (constrained coding regions) scores to identify MDRVs. Then gene set analyses were performed including over-representation (ORA) and weighted gene set based tests. STRING analysis was performed to identify potential biological network interactions. c Lateral side of mouse embryo at E10.5 with outline of tissues used for bulk RNA-sequencing (pharyngeal arches 2-6, PA2-6, blue; outflow tract and right ventricle, OFT + RV, green; left ventricle and atria, LV+atria, yellow).

