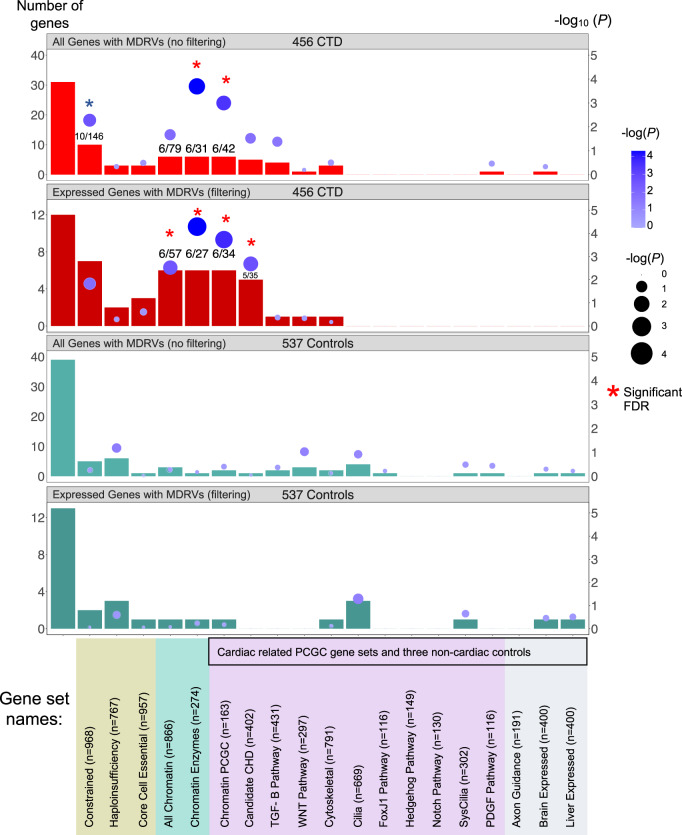
Fig. 2. Over-representation analysis (ORA) of recurrently affected genes identifies chromatin regulatory genes contributing risk to CTDs in 22q11.2DS.
Three different sources of gene sets totaling 19 are indicated by color below the bar graph (gene sets used by the PCGC to investigate sporadic CHD14 are indicated by black box, as well as in lilac and in gray). The first bar on the left in each panel shows the total number of recurrently affected genes (n) among all affected genes (N). The rest of the bars indicate the number of recurrently affected genes within each gene set (k) versus the final number of affected genes with MDRVs (most damaging rare variants) for each gene set (M) as indicated (see Methods for more details). The top two bar graphs show ORA results without filtering by gene expression levels in CTD cases (red) and with filtering (dark red) followed by the same for controls (green and dark green, respectively). The numbers in some of the bars denote the number of recurrently affected genes contained within the specific gene set / the total number of affected genes in this gene set. The gene set analyses were corrected for multiple testing by false discovery rare (FDR). Red asterisks denote significance after FDR correction; blue asterisk denotes borderline significance (P = 0.057).

