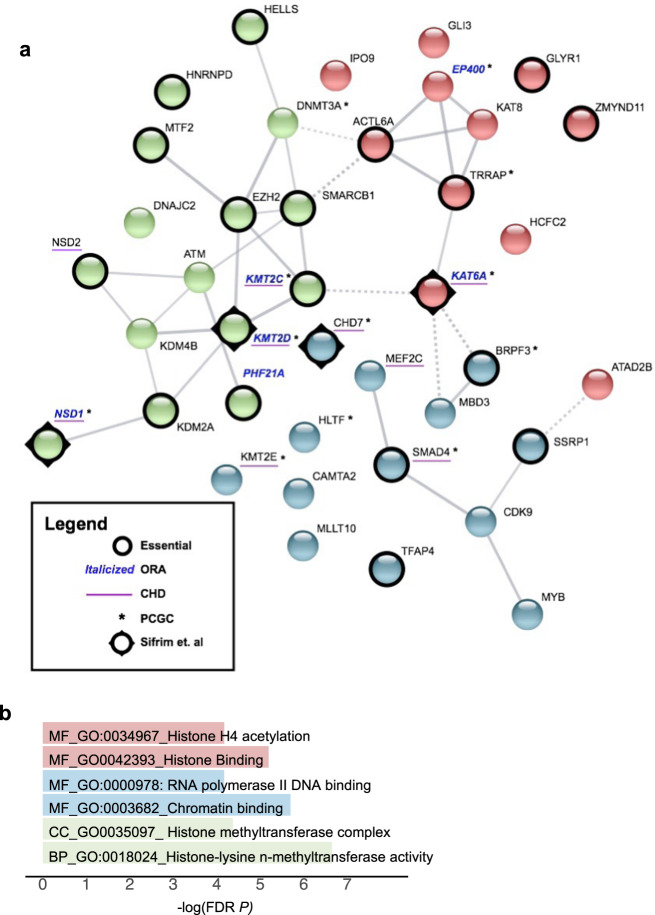
Fig. 5. Chromatin gene network of modifiers for CTDs in 22q11.2DS.
a STRING image of 39 chromatin genes as identified in 22q11.2DS subjects with CTDs. Edges indicate both functional and physical protein interactions (Protein-protein enrichment p-value, 5.03 × 10⁻¹⁴). The types of interaction evidence for the network edges are indicated by the line color (text mining, experiments, database, co-expression, neighborhood, gene fusion and co-occurrence). The high confidence score of 0.700 was used to create the network. Kmeans clustering was used to generate three clusters (cluster 1, red; cluster 2, blue; cluster 3, green). The nodes based on confidence; with line thickness indicates the strength of the support of the data in STRING. Six genes found by ORA are indicated (Italic blue font for gene names), chromatin genes found with de novo mutations in one or more cases with sporadic CHD (with asterisk next to the gene names). Constrained genes are indicated (Black circle surrounding nodes) and candidate sporadic CHD genes are shown (underscore for the gene names). b Representative most significant gene ontology terms from the STRING image, color coordinated according to the STRING image (molecular function, MF; cellular component, CC; biological process, BP). FDR, false discovery rate, -log10 P-value.

