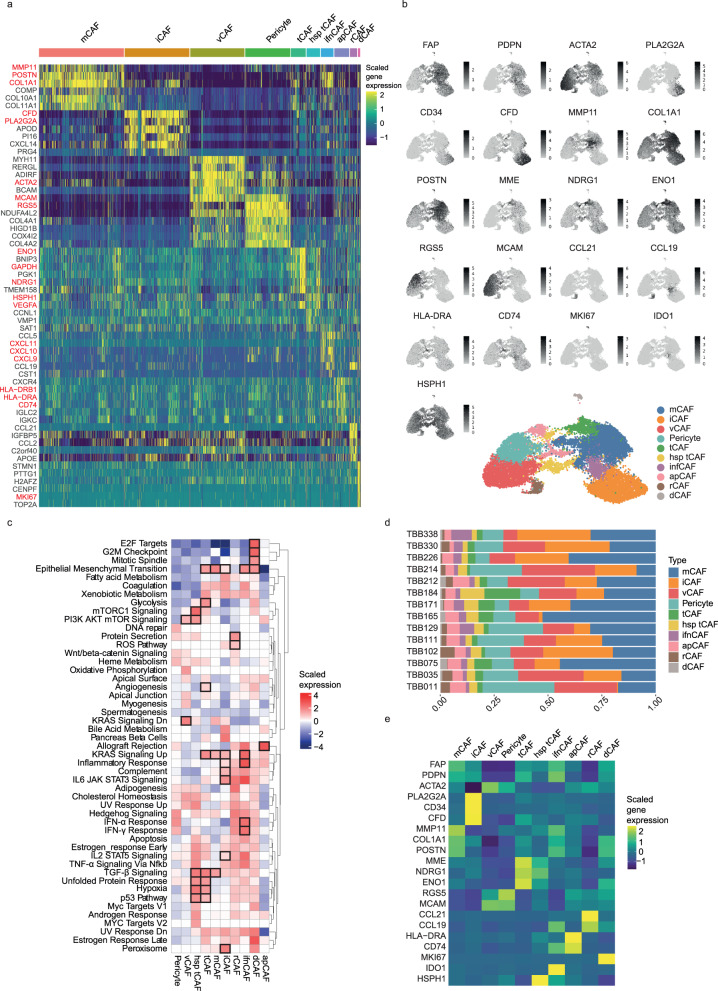
Fig. 2. Fibroblast heterogeneity in breast cancer.
a Heatmap of the top six differentially expressed genes for each cell type in scRNA-seq data of all stromal cells (n = 16,704). Cellular phenotypes are indicated above the heatmap. Key marker genes are highlighted in red. b UMAP of all stromal cells coloured by CAF type, together with the corresponding feature plots showing the expression level of selected marker genes for each cell. c Gene set enrichment analysis comparing the enrichment of hallmark pathways between CAF types. Boxes indicate the functional hallmark pathways that we used to define/annotate CAF types (see also Supplementary Data 7). d Proportion of all CAF types and pericytes per patient. e Heatmap showing the average gene expression level of all defined marker genes per identified cell type (after batch correction).

