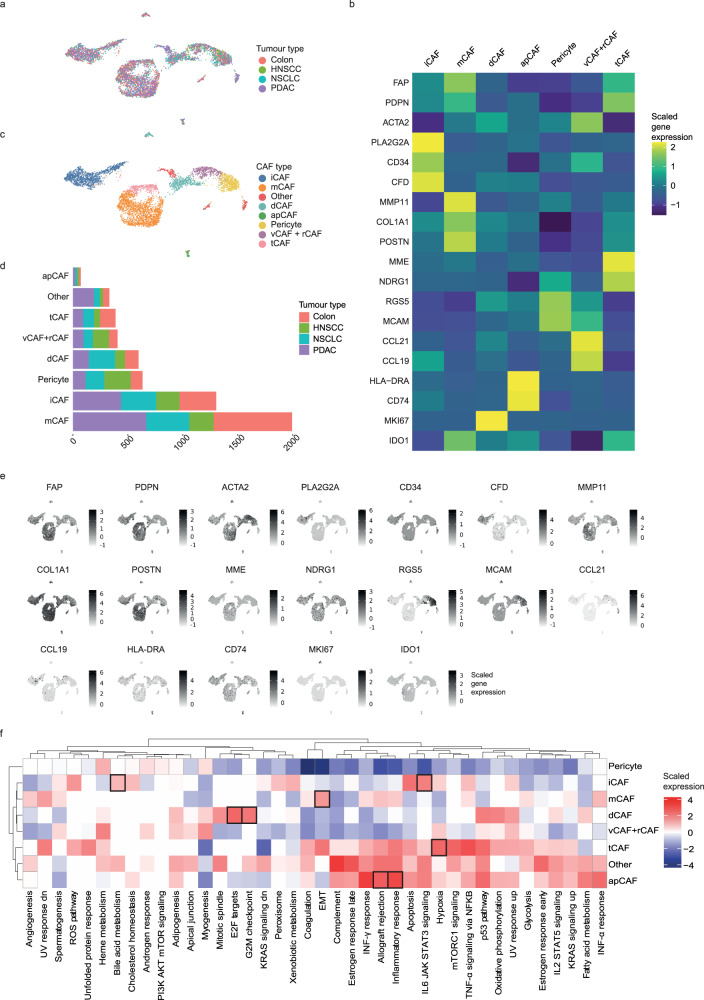
Fig. 3. Fibroblast heterogeneity in multiple cancer types.
a UMAP showing the validation datasets (non-small cell lung cancer (NSCLC), head-and-neck squamous cell carcinoma (HNSCC), colorectal cancer, pancreatic ductal carcinoma (PDAC)). b Heatmap showing the average marker gene expression of each identified cell type in the integrated validation dataset. c UMAP showing the final CAF classification of the validation cohort. d Bar chart showing the absolute numbers of all CAF types and pericytes as detected with unbiased clustering of the validation dataset and the respective proportions of each cell type per tumour type. e Feature plot showing the cellular expression levels of selected marker genes on the UMAP. f Heatmap showing the results of gene set enrichment analysis for all defined cell types. Boxes indicate the overlap of the top five enriched hallmark pathways between the integrated validation and breast cancer dataset.

