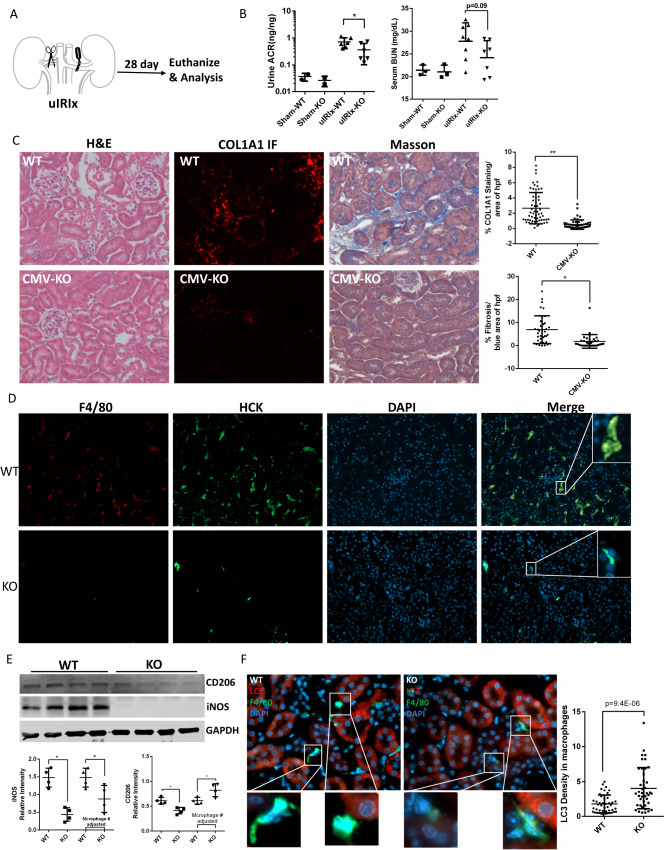
Fig. 6. HCK knockout reduced kidney fibrosis in uIRIx model with regulation of macrophage activation.
A Schematic diagram of strategy of uIRIx models. B Urine ACR and serum BUN for WT and HCK KO uIRIx mice. C Representative images of H&E, COL1A1 IF and Masson trichrome staining from WT and KO uIRIx kidneys. Morphometric quantification (n = 5 animals; 5 random fields/animal) of the COL1A1 (top) and Masson (lower) positive area. D Representative IF staining images and quantification of from kidneys of HCK and F4/80 macrophage from WT and HCK KO uIRIx kidneys. E Western blot and quantification of M1 and M2 macrophage markers from WT and HCK KO mice kidneys at 28 days post uIRIx. F Representative IF staining images and quantification of LC3 in macrophages from WT & HCK KO uIRIx kidneys. B, C and E *p < 0.05 with t test. Source data are provided as a Source Data file.

