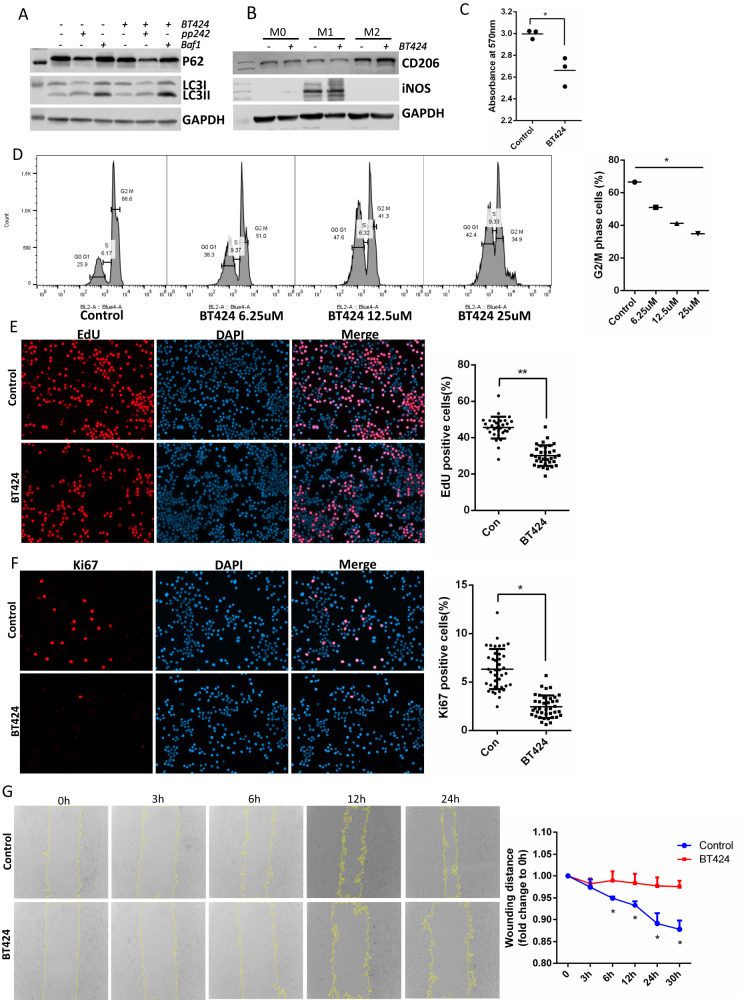
Fig. 8. HCK inhibitor BT424 regulated macrophage activation and autophagy in vitro.
Western blot to show BT424 regulation of autophagy (A) and macrophage polarization (B) in Raw264.7 macrophage cell line. C MTT assay was tested for BT424 treatment with gradient dosages for cell proliferation in Raw264.7. D Representative of flow cytometric image and quantification for propidium Iodide (PI) stain to measure cell cycle for control and BT424 treatment in Raw264.7 cells. E Click-iT™ EdU cell proliferation assay and Ki67 IF staining (F) were performed to measure proliferation of Raw264.7 with control and BT424 treatment. G Scratch assay was performed in Raw264.7 cells for control and BT424 treatment. The yellow lines are the scratch edge of the cells generated by the software when to measure the scratch distance. C–G *p < 0.05, D with ANOVA test, others with t test. Baf1: bafilomycin A1. Source data are provided as a Source Data file.

