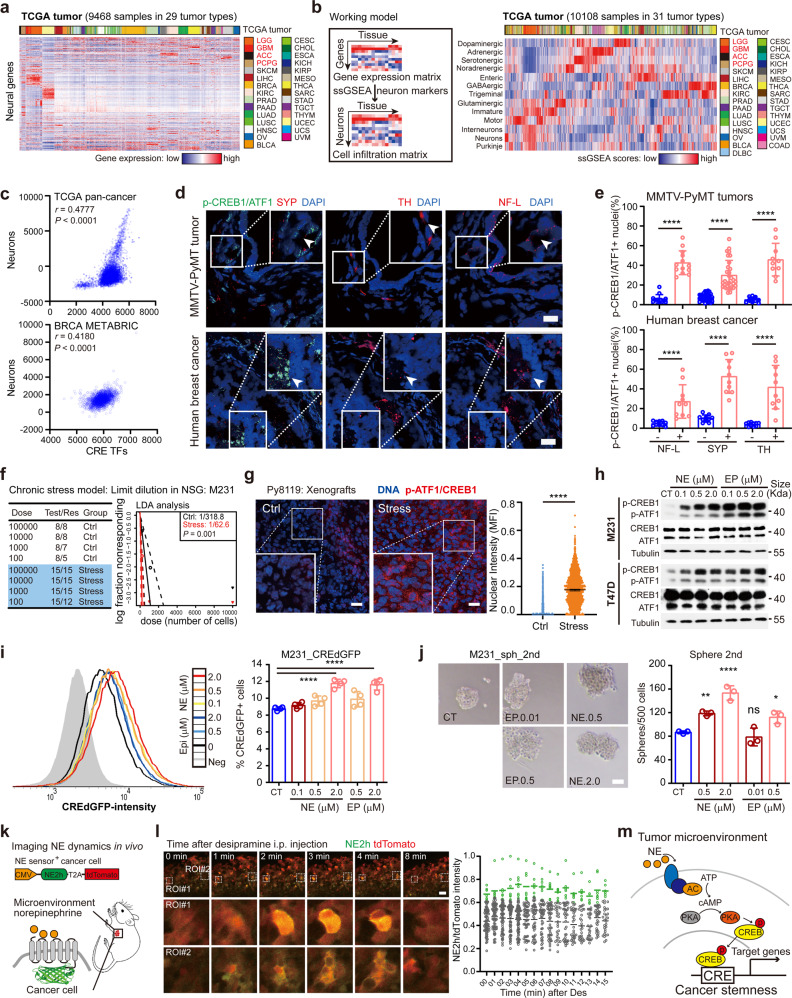
Fig. 2.
Proximal neural signals activate CRE-dependent stemness. a Heatmap showing the expressions of neural specific genes in TCGA tumors. Sidebar, tumors types. b Left panel, single sample GSEA (ssGSEA) based deconvolution of tissue associated nerves based on the gene expression profiles from the bulk RNA-seq data by neural specific marker gene set based analysis in individual tumors. Right panel, The neural signals in TCGA tumors according to the ssGSEA enrichment scores. c Correlation of CRE activity with neural signals in the pan-cancer (TCGA, upper panel) and METABRIC (breast cancer, lower panel) tumors. Correlations (Pearson r) between CRE and specific neural signals were determined according to their ssGSEA scores in individual tumors (P values, Pearson correlation). d Immunofluorescent analysis of phospho-CREB1/ATF1 intensity (green), neural markers (NF-L, TH and SYP, red) in mouse MMTV-PyMT (upper panel) and human (lower panel) breast tumors. Scale bar, 20 μm. e Nuclear phospho-CREB1/ATF1 intensity indicated by the percentages of phospho-ATF1/CREB1 positive nuclei per field (0.01 mm2 within neural marker positive area, n = 10) in mouse (upper panel) and human (lower panel) breast tumors, respectively. Neural signal negative area (n = 10) was used as controls (mean ± SD; 2-sided t test). f In vivo limit dilution assay of MDA-MB-231 cells in control or chronic stressed NSG mice. Differences in stem cell frequencies were determined by ELDA (https://bioinf.wehi.edu.au/software/elda/). n = 8 and 15 for control and stress groups, respectively. g Representative immunofluorescent staining of phospho-CREB1/ATF1 in Py8119 xenografts from control (Ctrl) and stressed (stress) mice (left panel). Quantification of nuclear phospho-CREB1/ATF1 intensity (median fluorescent intensity, MFI) in immunofluorescent Py8119 xenografts (right panel, n = 1295 and 1476 for control and stressed groups; mean ± SD; 2-sided t test). Scale bar, 20 μm. h Western blot analysis of MDA-MB-231 (upper panel) and T47D (lower panel) cells treated with epinephrine (EP) and norepinephrine (NE) for 30 min. Cell extracts were analyzed with phospho-CREB1/ATF1, total ATF1/CREB1 and Alpha-tubulin antibodies. i Left panel, flow cytometry analysis of CRE-dGFP reporter activity of MDA-MB-231 cells in response to 24 hr NE/EP treatment. Parental MDA-MB-231 cells without reporter transfection (Neg) were used as control. Right panel, percentage of CRE-dGFP+ cells in MDA-MB-231 in response to NE/EP treatment (24 hr). j Secondary sphere formation of MDA-MB-231 cells in the presence of NE/EP. Representative images of spheres were present. Scale bar, 60 μm. (for 2i–j, n = 4; mean ± SD; P values, Tukey’s multiple comparisons after 1-way ANOVA). k Schematic illustration of the experimental design for the time-lapse imaging of norepinephrine activity in the tumor microenvironment using fluorescent norepinephrine reporter (GRABNE2h). l Left panel, representative images of GRABNE2h (green) and tdTomato (red) activity in the MDA-MB-231 xenograft before (0 min) and after (1-4 min) i.p. injection of the norepinephrine transporter (NET) blocker desipramine (10 mg/kg). Scale bar, 60 μm. Right panel, median fluorescent intensity of GRABNE2h fluorescence (upper) and tdTomato (lower) in the MDA-MB-231 xenograft following treatment with the desipramine (10 mg/kg). n = 75 cells from 3 mice for each condition. m Model of TME NE dependent cAMP responsive program that acts as a conserved mechanism driving cancer stemness. *P < 0.05; **P < 0.01; ***P < 0.001; ****P < 0.0001; ns not significant

