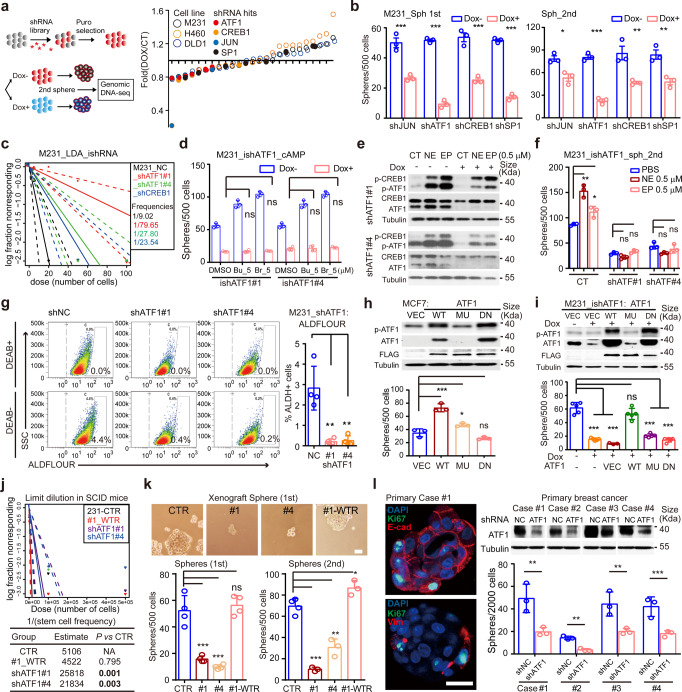
Fig. 3.
ATF1 dictates TME neural signals to potentiate cancer stemness. a A scheme illustrating the doxycycline (Dox) inducible shRNA (iDox-shRNA) library based functional screen to identify candidate CRE transcription factors for cancer stemness in three independent cancer cell lines (MDA-MB-231, H460 and DLD1). Top shRNA hits were labeled with distinct dots (blue, orange, black and red for oligos targeting JUN, CREB1, SP1 and ATF1, respectively). b Primary (left panel) and secondary (right panel) sphere formation of MDA-MB-231 cells expressing iDox-shRNAs against ATF1, CREB1, JUN and SP1. Cells were pretreated with Dox for 3 days prior to sphere formation assays (n = 3; mean ± SD; P values, Tukey’s multiple comparisons after 1-way ANOVA). c In vitro limit dilution assay of iDox-shATF#1/#4 and iDox-shCREB1 cells of MDA-MB-231. Differences in stem cell frequencies were determined by ELDA (https://bioinf.wehi.edu.au/software/elda/). n = 6 for each group. d Sphere formation of MDA-MB-231 iDox-shATF1 (shRNA#1 and #4) cells treated with Dox in combination with DMSO or cAMP mimics for 3 days prior to sphere formation assays (n = 3; mean ± SD; P values, Tukey’s multiple comparisons after 1-way ANOVA). e Western blot analysis of iDox-shATF1 MDA-MB-231 cells with/without Dox treatment with indicated antibodies. Cells were treated with epinephrine (EP, 0.5 μM) and norepinephrine (NE, 0.5 μM) for 30 min before harvesting. f Secondary sphere formation of iDox-shATF1 MDA-MB-231 cells. Cells with/without Dox were treated with NE/EP (0.5 μM) in sphere formation assays. g Flow cytometry analysis for ALDEFLUOR activity among iDox-shATF1 MDA-MB-231 cells (shRNA#1 and #4, left panel). Differences of ALDEFLUOR+ cells among groups were determined by one-way ANOVA (right panel). h Western blot analysis of MCF-7 cells expressing vector (Vec) or different forms of ATF1 (wild type (WT), S63A (MU) and R231L (DN), upper panel). Sphere formation of MCF-7 cells expressing different forms of ATF1 (lower panel). i Western blot analysis of iDox-shATF1#1 MDA-MB-231 cells expressing vector (Vec) or different forms of ATF1(wild type (WT), S63A (MU) and R231L (DN)). Sphere formation of iDox-shATF1#1 MDA-MB-231 cells rescued with vectors or ectopic ATF1 (lower panel). For f–i, n = 3; mean ± SD; P values, Tukey’s multiple comparisons after 1-way ANOVA. j In vivo limit dilution assay of iDox-shATF1 (shRNA#1 and #4) or iDox-shATF1 rescued (#1_WTR) MDA-MB-231 cells. Differences in stem cell frequencies were determined by ELDA (n = 10 for each group). k Sphere formation of MDA-MB-231 derived xenografts from j. Scale bars, 60 μm. l Left panel, immunofluorescence of E-cadherin (E-cad), Vimentin (Vim), Ki67 and DAPI in primary human breast cancer cells maintained in Matrigel. Right panel, Western blot analysis of primary breast cancer cells expressing shNC (control) or shATF1#1 vectors (pLKO.1_GFP_shRNA). Sphere formation of primary breast cancer cells from four cases (Case #1-#4) expressing shATF1 or shNC (nontarget control, (for k–l, n = 3; mean ± SD; P values, Tukey’s multiple comparisons after 1-way ANOVA). *P < 0.05; **P < 0.01; ***P < 0.001; ****P < 0.0001; ns not significant

