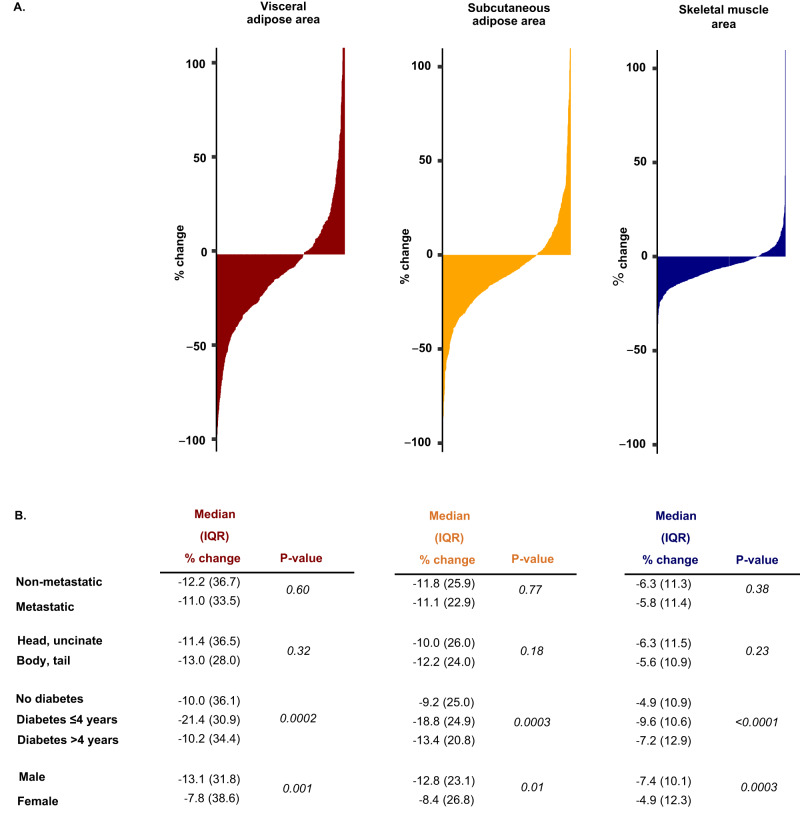
Fig. 4. Change in adipose and skeletal muscle tissue measurements in prediagnostic period in individual patients.
A Waterfall plots of visceral (red), subcutaneous (yellow) and skeletal muscle tissue (blue) measurement changes between prediagnosis and at-diagnosis CT scan. Each vertical line corresponds to one pancreatic cancer case. B Change in adipose and skeletal muscle tissue between prediagnosis and at-diagnosis CT scan by select patient characteristics. Diabetes status and duration related to the time of pancreatic cancer diagnosis. P-values calculated using two-sided Wilcoxon rank sum test. Source data are provided as a Source Data file.

