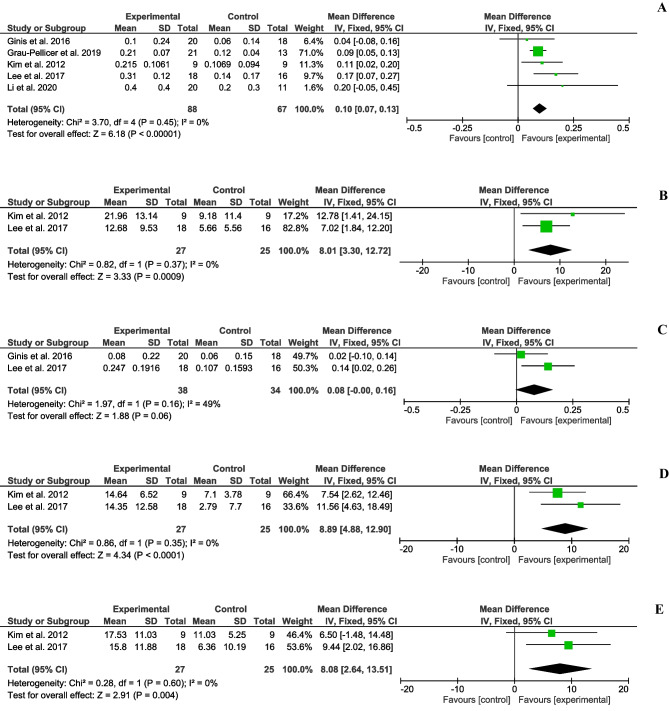
Fig. 2.
Forest plots of gait spatiotemporal parameters. (A) Mean difference (95% CI) of effect of mHealth vs. conventional therapy on speed; (B) Mean difference (95% CI) of effect of mHealth vs. conventional therapy on cadence; (C) Mean difference (95% CI) of effect of mHealth vs. conventional therapy on stride length; (D) Mean difference (95% CI) of effect of mHealth vs. conventional therapy on affected step length; (E) Mean difference (95% CI) of effect of mHealth vs. conventional therapy on non-affected step length; CI: Confidence interval; IV: Inverse variance; SD: Standard deviation

