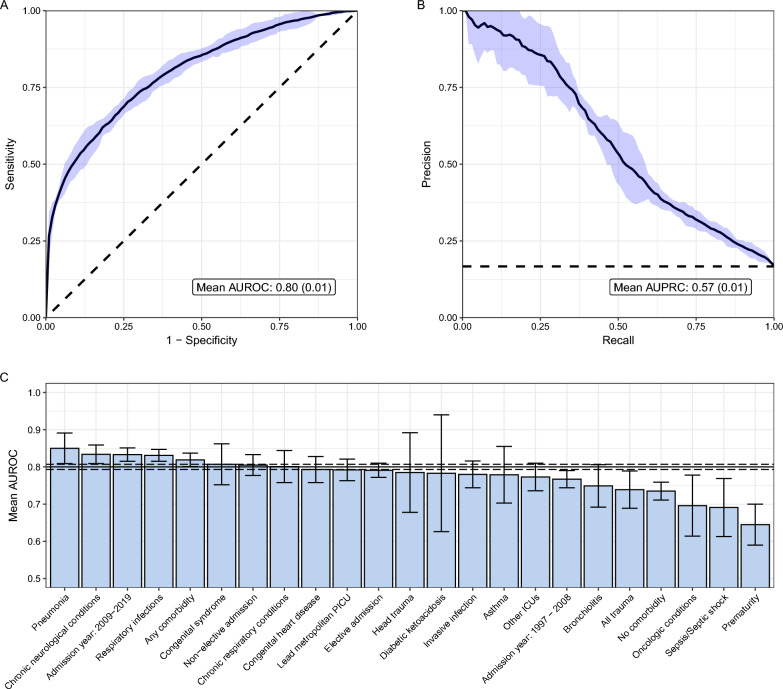
Fig. 2.
Mean area under the receiver operating characteristic curve (AUROC) (A), mean area under the precision recall curve (AUPRC) (B), and mean AUROCs for specific patient subgroups (C) of the machine learning model predicting failure to meet National Minimal Standard in school. Curves represent findings across cross-validation folds for the combined model. Shading indicates ± two standard deviation error (A, B), and ± one standard deviation error for patient subgroups (C). The horizontal lines (C) indicate the mean AUROC ± one standard deviation of the entire cohort

