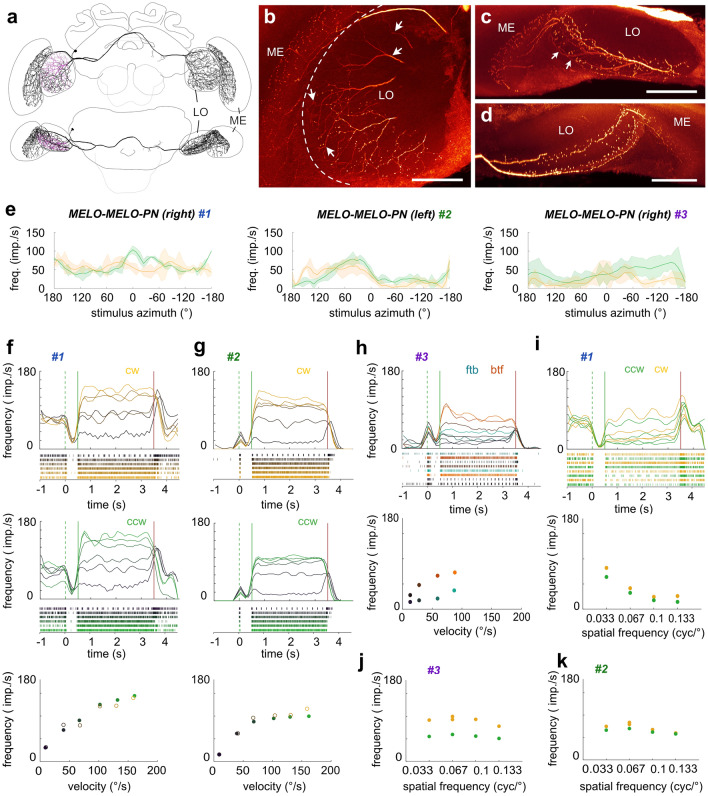
Fig. 7.
Anatomy and physiology of inter-medulla/lobula neurons (MELO-MELO-PNs). a Frontal (top) and ventral (bottom) view of the 3D reconstruction of a MELO-MELO-PN. b–d Maximal intensity projection of a few optical sections of the confocal stack illustrating the arborizations of a neurobiotin-injected MELO-MELO-PN in the ipsilateral lobula and medulla (b, c) and the contralateral lobula and medulla (d). Frontal view (b), ventral view (c, d). Arrows indicate smooth fibers. e Average response curves of three individual cells during receptive field mapping. Yellow: cw movement, green: ccw movement. f Activity of the MELO-MELO-PN #1 of the right hemisphere in response to cw (yellow) and ccw (green) wide-field optic flow of different velocities (dark to light yellow/green, values: 10°/s, 40°/s, 70°/s, 100°/s, 130°/s, and 160°/s). Green dotted lines: grating presented; green solid lines: motion onset; red lines: motion stop. Bottom graph: mean response frequency during the final 2 s of each stimulus bout of the cw and ccw stimulus sequence. g Same as in (f) but for the MELO-MELO-PN #2 of the left hemisphere. h Activity of the MELO-MELO-PN #3 of the right hemisphere in response to front-to-back (ftb) and back-to-front (btf) optic flow of different velocities (dark to light cyan/orange, values: 15°/s, 30°/s, 60°/s, and 90°/s). i Activity of the MELO-MELO-PN #1 in response to cw (yellow) and ccw (green) optic flow of different spatial frequencies. Bottom graph: mean response frequency during the final 2 s of each stimulus bout. j, k Same as in the bottom graph in (i) but for the other two MELO-MELO-PNs. All stimuli without ND filters

