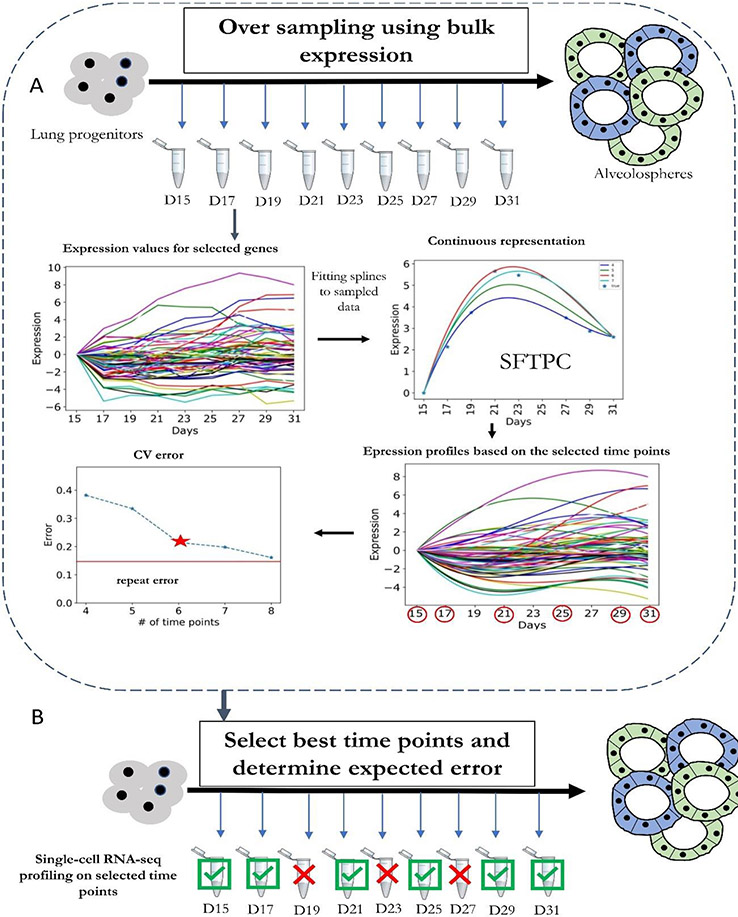
Figure 2. Selecting time points to sample in single-cell RNA-seq experiments.
a ∣ Oversampling of bulk RNA sequencing (RNA-seq) data. The bulk data are then used to determine the expected error for each potential subset of time points used. A heuristic search is then performed to select the optimal set of time points given cost or error constraints. b ∣ Selected time points are then used to profile single-cell RNA sequencing (scRNA-seq) data. Errors computed in (a) for this subset of time points can be used to bound the expected difference between reconstructed and underlying expression levels. CV, coefficient of variation; D, days; SFTPC, pulmonary surfactant-associated protein C (a marker of AT2 alveolar stem cells).

