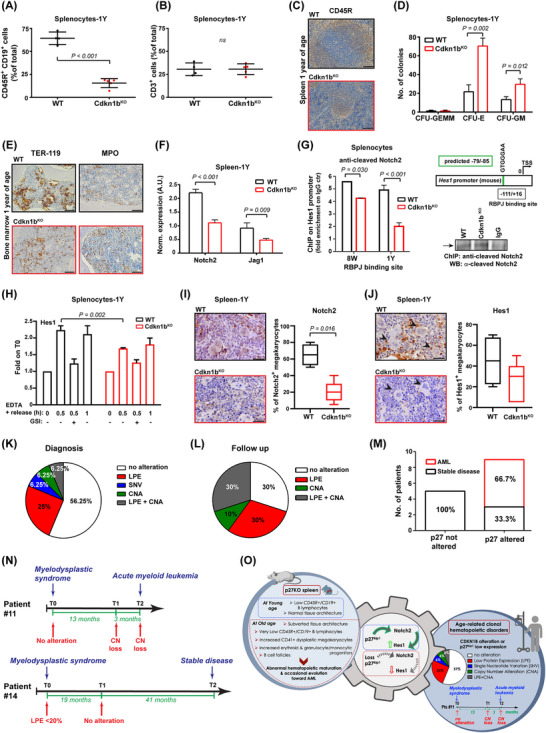
FIGURE 1.

Cdkn1bKO mice developed an MDS linked to Notch2 pathway alteration. (A‐B) Graph reports the CD45R+ CD19+ (A) and CD3 (B) positive splenocytes, extracted from 1Y WT or Cdkn1bKO mice, analyzed by FACS and expressed as mean ± SD. The percentage of CD45R+ CD19+ cells is strongly impaired in 1Y Cdkn1bKO spleen. Each dot corresponds to one mouse. (C) Representative images of spleen sections from 1Y WT (n = 5, upper panel) and Cdkn1bKO (n = 16, lower panel) mice, stained for B cells marker CD45R through IHC. Pictures shows a profound alteration in spleen architecture of Cdkn1bKO mice. Scale bars, 100 μm. (D) Graph reports the quantification of CFU derived from 1Y WT and Cdkn1bKO splenocytes. Numbers of CFU‐E, CFU‐GM, and CFU‐GEMM progenitor cell‐derived colonies were assessed. A higher number of CFU‐E and CFU‐GM colonies was generated by 1Y Cdkn1bKO splenocytes compared to WT counterpart. Results represent the mean ± SD of n = 3 independent experiments, assayed in triplicate. (E) Representative IHC of bone marrow sections stained for the immature erythroid marker TER‐119 and myeloid precursor MPO, from 1Y WT (n = 5, upper panel) and Cdkn1bKO (n = 5, lower panel) mice. Disarrangement of TER‐119+ erythroid islands and non paratrabecular distribution of MPO+ myelocytes is present in Cdkn1bKO sections. Scale bars, 50 μm. (F) qRT‐PCR analysis of Notch2 receptor and Jagged‐2 ligand in spleen collected from 1Y WT and Cdkn1bKO mice. A decreased expression of Notch2 and Jagged‐2 was found in Cdkn1bKO spleen. Results (mean ± SD) derive from the use of n = 6 samples/genotype, performed in duplicate, normalized and expressed in A.U. (G) ChIP of WT and Cdkn1bKO splenocytes from 8W and 1Y mice (pool of 3 samples/genotype/age), as indicated, treated with EDTA 10 mmol/L for 20 minutes. The binding of anti‐cleaved Notch2 antibody to the Hes1 promoter (RBPJ binding site) was evaluated. Data are expressed as fold enrichment over the value of ChIP performed with control IgG. On the right, schematic representation of amplified mouse Hes1 promoter region containing the predicted RBPJ binding sequence (‐79/‐85, in green) (upper panel) and WB reporting representative chromatin IP in WT and Cdkn1bKO splenocytes, using anti‐cleaved Notch2 antibody or control IgG (lower panel). Notch2 binds significantly less to the Hes1 promoter in Cdkn1bKO splenocytes, compared to WT ones. (H) qRT‐PCR analysis of Notch target gene Hes1, in WT or Cdkn1bKO splenocytes treated with EDTA 10 mmol/L for the indicated times and pre‐treated or not with GSI 20 mmol/L for 2 hours. After EDTA stimulation, Cdkn1bKO splenocytes display a decreased transcription of Hes1. Results (mean ± SD) derive from the use of n = 3 splenocytes populations/genotype. (I‐J) IHC analysis and quantification of Notch2 (I) and Hes1 (J) positive megakaryocytes in spleen from 1Y WT (upper panels) or Cdkn1bKO mice (lower panels). Images shows an impaired expression of Notch2 and Hes1 in Cdkn1bKO spleen. Scale bars, 30 μm. In J, arrowheads point to megakaryocytes. (K) Pie chart reports the percentage of patients affected by MDS (n = 32, see Supplementary Table S1) that, at diagnosis, show low p27 protein expression evaluated in bone marrow sections via IHC (LPE), CDKN1B single nucleotide variant (SNV) or copy number alteration (CNA). The presence of SNV in CDKN1B sequence was assessed through NGS analysis, the CNA through ddPCR. At diagnosis, more than 40% of MDS patients results to be altered for p27. (L) Same as in (K), but referred to the follow‐up of 10 out of 18 patients that showed no alteration of p27 at diagnosis. Graph indicates that 70% of MDS patients acquire p27 alterations during follow up. (M) Graph reports the number and percentage of MDS patients that evolved in AML, stratified according to p27 status. When p27 protein or gene is altered, most of patients (66,7%) evolved in AML. (N) Timelines of two representative MDS patients. Alteration in p27 protein or gene at diagnosis (T0) and follow up (T1, T2) are indicated. Patient #11 acquired CDKN1B copy number loss during follow up and evolved in AML. Patient #14 presented no alteration in p27 protein or gene during follow up and maintained a stable disease. (O) Schematic representation of this work. Loss or dysregulation of p27 is associated with development and progression of clonal hematopoietic disorders in human and mice likely, through the regulation of Notch2 signaling. In all graphs, statistical significance was calculated by Student's t‐test or Mann–Whitney, as appropriate, and expressed by P < 0.05.
Abbreviations: WT, wild‐type; KO, knock‐out; 1Y, 1‐year old; FACS, fluorescence‐activated cell sorting; SD, standard deviation; IHC, immunohistochemistry; CFU, colony forming unit; CFU‐E, colony forming unit‐erythroid; CFU‐GM, colony forming unit‐granulocyte monocyte; CFU‐GEMM, colony forming units‐granulocyte, erythrocyte, monocyte, megakaryocyte; MPO, myeloperoxidase; qRT‐PCR, quantitative reverse transcription polymerase chain reaction; A.U., arbitrary units; ChIP, chromatin immunoprecipitation; 8W, 8‐weeks old; EDTA, ethylenediamine tetraacetic acid; RBPJ, recombining binding protein suppressor of hairless; IgG, immunoglobulin G; WB, western blot; IP, immunoprecipitation; GSI, g‐secretase inhibitor; MDS, myelodysplastic syndrome; LPE, low protein expression; SNV, single nucleotide variant; CNA, copy number alteration; NGS, next generation sequencing; ddPCR, droplet digital polymerase chain reaction; AML, acute myeloid leukemia; CHD, clonal hematopoietic disorder.
