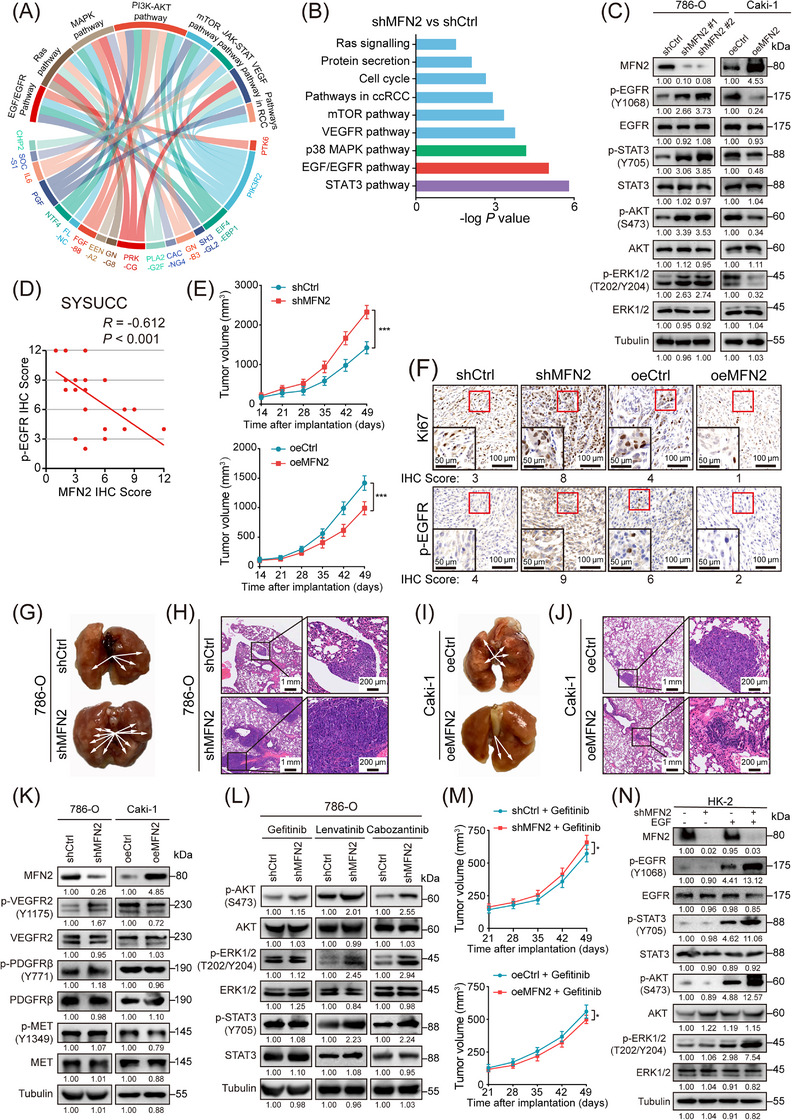
FIGURE 2.

MFN2 inhibits the proliferation and metastasis of ccRCC via EGFR signaling. (A) Chord graph representing 17 differentially expressed genes between MFN2 high and low expression groups in TCGA‐KIRC cohort and the association of these genes to the corresponding oncogenic pathways. (B) Pathway analysis showed the significantly altered signaling pathways upon knockdown of MFN2 in 786‐O cells. (C) Western blotting analysis of EGFR pathway proteins in MFN2‐knockdown 786‐O cells and MFN2‐overexpressed Caki‐1 cells using the indicated antibodies. (D) Correlation analysis between MFN2 and p‐EGFR protein levels in human ccRCC samples (n = 30). (E) Growth curves of tumors from BALB/c nude mice subcutaneously implanted with MFN2‐knockdown and control 786‐O cells (upper panel) or MFN2‐overexpressing and control Caki‐1 cells (lower panel) (5 mice/group). Tumor volumes were measured at the indicated times. (F) Representative IHC staining images of Ki67 and p‐EGFR in MFN2 knockdown 786‐O tumors or MFN2 overexpression Caki‐1 tumors. IHC Scores are shown at the bottom. (G‐H) Representative images of lungs with metastatic nodules (G) and H&E staining (H) of metastatic lesions in the lungs of BALB/c nude mice after tail vein injection with MFN2‐knockdown and control 786‐O cells (n = 5 per group). Arrows indicate the metastatic colonies in the lung tissues. (I‐J) Representative images of lungs with metastatic nodules (I) and H&E staining (J) of metastatic lesions in the lungs of BALB/c nude mice after tail vein injection with MFN2‐overexpression and control Caki‐1 cells (n = 5 per group). Arrows indicate the metastatic colonies in the lung tissues. (K) Western blotting analysis of indicated RTKs (VEGFR2, PDGFRβ, c‐MET) in MFN2 knockdown 786‐O cells or MFN2 overexpression Caki‐1 cells using the indicated antibodies. (L) Western blotting analysis of indicated proteins in MFN2 knockdown 786‐O cells treated with indicated RTK inhibitors. (M) Growth curves of tumors from BALB/c nude mice subcutaneously implanted with MFN2 knockdown and control 786‐O cells (upper panel) or MFN2 overexpression and control Caki‐1 cells (lower panel) treated with Gefitinib (50 mg/kg, 5 mice per group). Tumor volumes were measured at the indicated times. (N) Western blotting assay of EGFR pathway proteins in MFN2 knockdown HK‐2 cells with or without EGF stimulation (100 ng/mL) using the indicated antibodies, Data are presented as means ± SD. ns, not significant. * P < 0.05, *** P < 0.001, by one‐way ANOVA (E, M) or Person's correlation analysis (D).
Abbreviations: oeCtrl, empty overexpression control; oeMFN2, overexpression of MFN2; shCtrl, negative control shRNA; shRNA, short hairpin RNA; IHC, immunohistochemistry; SYSUCC, Sun Yat‐sen University Cancer Center; VEGFR, vascular endothelial growth factor receptor; PDGFR, platelet‐derived growth factor receptor; MET, mesenchymal epithelial transition factor. p‐EGFR, phosphorylated epidermal growth factor receptor; p‐AKT, phosphorylated protein kinase B; p‐ERK1/2, phosphorylated extracellular signal‐regulated kinase 1/2; H&E, hematoxylin and eosin; RTK, receptor tyrosine kinase.
