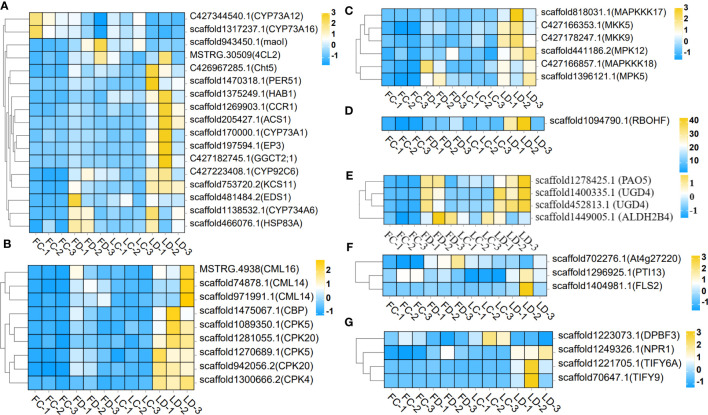
Figure 5.
Heatmap of gene expression levels in the leaf bud corms and flower bud corms of A. muelleri infected with F. solani. The scale bar represents the expression level of each gene (FPKM) in different treatments, as indicated by yellow/blue rectangles. Genes in yellow were upregulated, and those in blue were downregulated. (A) Plant secondary metabolite biosynthesis pathway genes; (B) Ca2+ signaling pathway genes; (C) MAPK signaling pathway genes; (D) ROS metabolic pathway gene; (E) Ascorbic acid metabolism pathway genes; (F) PTI genes; (G) plant hormone signaling transduction pathway genes.

