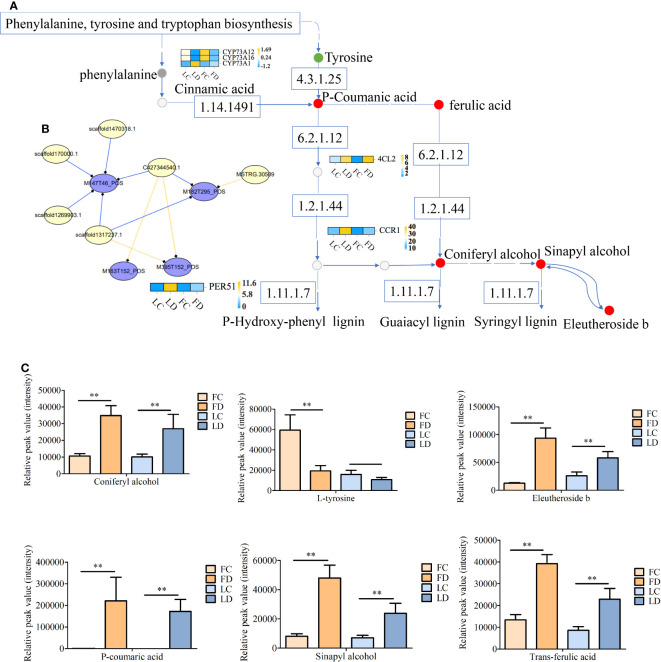
Figure 8.
Schematic of the phenylpropane biosynthesis pathway. (A, B) Correlation diagram (A), correlation network diagram of DEGs and DAMs (B), and histogram of the relative content of DAMs involved in the phenylpropane biosynthesis pathway (C). MSTRG.30509: 4-coumarate-CoA ligase (4CL2); scaffold1470318.1: peroxidase (PER51); C427344540.1: trans-cinnamate 4-monooxygenase (CYP73A12); scaffold1317237.1: trans-cinnamate 4-monooxygenase (CYP73A16); scaffold170000.1: trans-cinnamate 4-monooxygenase (CYP73A1); scaffold1269903.1: cinnamoyl-CoA reductase (CCR1); M182T295_POS: DL-tyrosine; M163T152_POS: coniferyl alcohol; M177T173_POS: trans-ferulic acid; M395T152_POS: eleutheroside b; M193T150_POS: sinapyl alcohol; M147T46_POS:P-coumaric acid. In (B), yellow line indicates negative regulation, and blue line indicates positive regulation. ** on the bars indicate significant differences at different infection times (Student’s t-test, P < 0.05).

