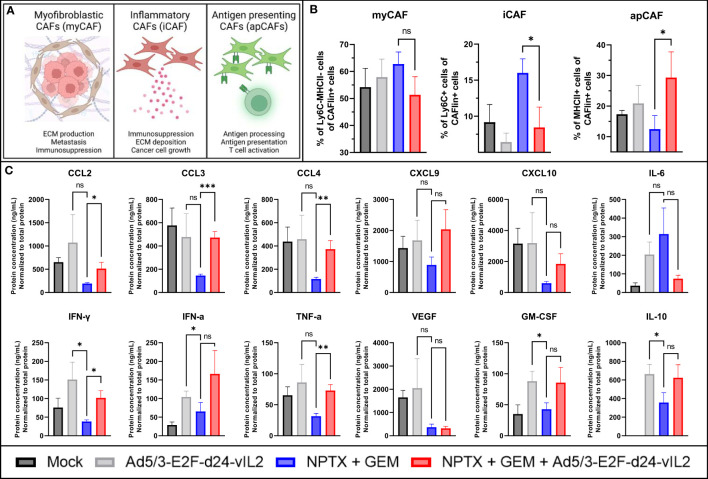
Figure 6.
In vivo evaluation of TME on day 10. (A) Graphical representation of different CAFs and their functions. (B) Evaluation of intratumoral CAF subsets by flow cytometry. CAFlin = CD45-EPCAM-PDPN+ (C) Changes in intratumoral cytokines. Difference between groups measured by an unpaired T-test with Welch’s correction. Error presented as SEM. Significance denoted as p-value < 0.05 = *, < 0.01 = **, < 0.001 = ***. N=5 biological replicates for all experiments.

