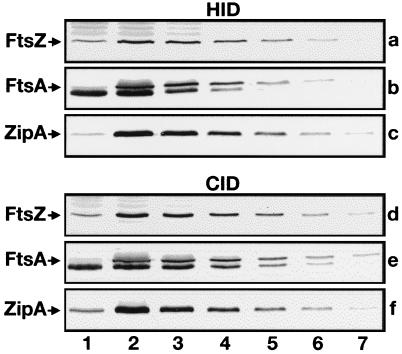
FIG. 3.
Depletion of division proteins. Immunoblots showing cellular levels of FtsZ (a and d), FtsA (b and e), or ZipA (c and f) after growth of the corresponding HID, CID, and wild-type control strains at either 42°C (a to c) or 30°C (d to f). Lanes 1 contained 70 μg of total protein of depletion strains PB143/pCX41 (a), CH2/pDB280 (b), CH5/pCH32 (c), PB143/pDB346 (d), CH2/pDB355 (e), and CH5/pDB361 (f). Lanes 2 through 7 contained 70, 35, 18, 9, 4, and 2 μg of protein, respectively, of control strains CH3/pMAK700 (a to c), CH3/pDB346 (d), CH3/pDB355 (e), and CH3/pDB361 (f). Proteins were detected with polyclonal antisera. The anti-FtsA serum showed some reactivity to an abundant 40-kDa species (most likely EF-Tu) which migrated slightly faster than FtsA (b and e). Measurements of band intensities indicated that, in each case, the cellular concentration of the depleted division protein was less than 15% of its normal concentration.

