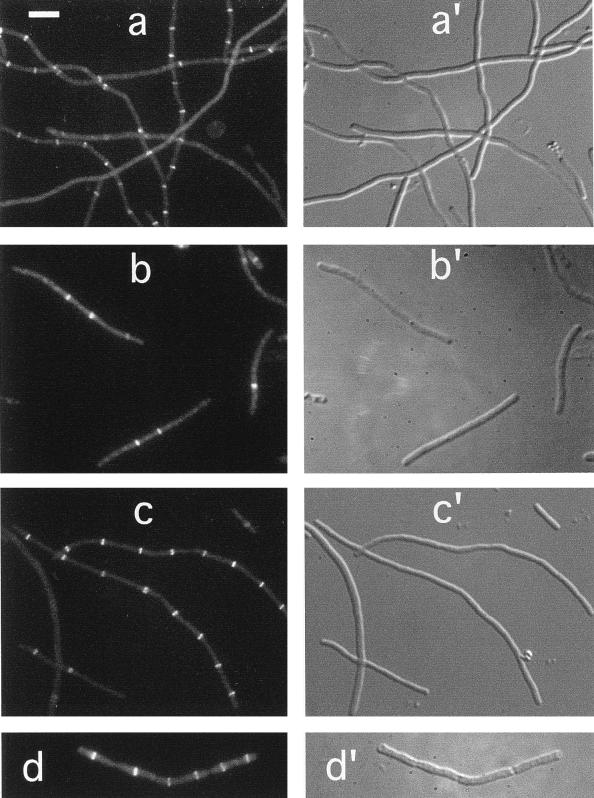
FIG. 5.
Localization of FtsZ in ZipA− and FtsA− filaments. Fluorescence (a through d) and differential interference contrast (a′ to d′) micrographs showing the location of Gfp-FtsZ (a and c) or native FtsZ (b and d) in filaments depleted for ZipA (a and b) or FtsA (c and d). Cells shown are from the ZipACID strain CH5(λDR120)/pDB361 [zipA::aph(Plac::gfp-ftsZ)/cI857 PλR::zipA+] (a), the ZipAHID strain CH5/pCH32 (zipA::aph/repAts ftsZ+ zipA+) (b), the FtsACID strain CH2(λDR120)/pDB355 [ftsA0(Plac::gfp-ftsZ)/cI857 PλR::ftsA+] (c), and the FtsAHID strain CH2/pDB280 [ftsA0/repA(Ts) ftsA+] (d). Cells in panels b and d were grown at 42°C prior to staining with FtsZ-specific monoclonal antibodies. Cells in panels a and c were grown at 30°C in the presence of 50 μM IPTG and were observed immediately after chemical fixation. Bar in panel a represents 5.0 μm.

