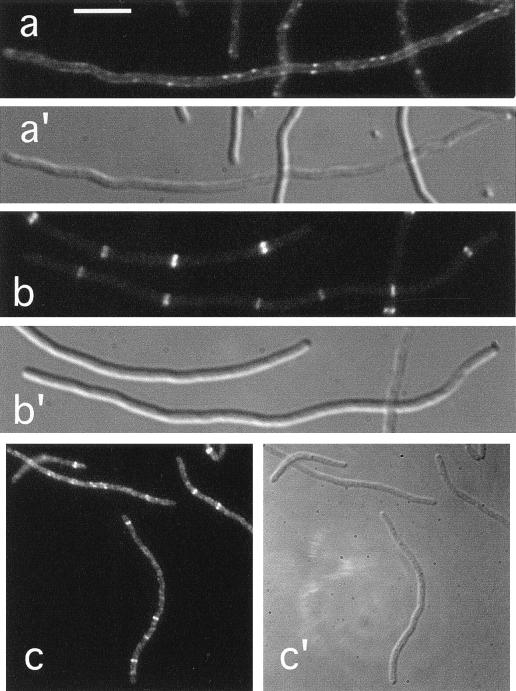
FIG. 6.
Localization of FtsA in FtsZ− and ZipA− filaments. Fluorescence (a to c) and differential interference contrast (a′ to c′) micrographs showing the location of Gfp-FtsA (a and b) or native FtsA (c) in filaments depleted of FtsZ (a) or ZipA (b and c). Cells shown are from the FtsZCID strain PB143(λCH75)/pDB346 [ftsZ0(Plac::gfp-ftsA)/cI857 PλR::ftsZ+] (a), the ZipACID strain CH5(λCH75)/pDB361 [zipA::aph(Plac::gfp-ftsA)/cI857 PλR::zipA+] (b), and the ZipAHID strain CH5/pCH32 [zipA::aph/repA(Ts) ftsZ+ zipA+] (c). Cells in panel c were grown at 42°C prior to staining with affinity-purified anti-FtsA antiserum. Cells in panels a and b were grown at 30°C in the presence of 25 μM IPTG and were observed immediately after chemical fixation. Bar represents 5.0 (a and b) or 11.0 (c) μm.

