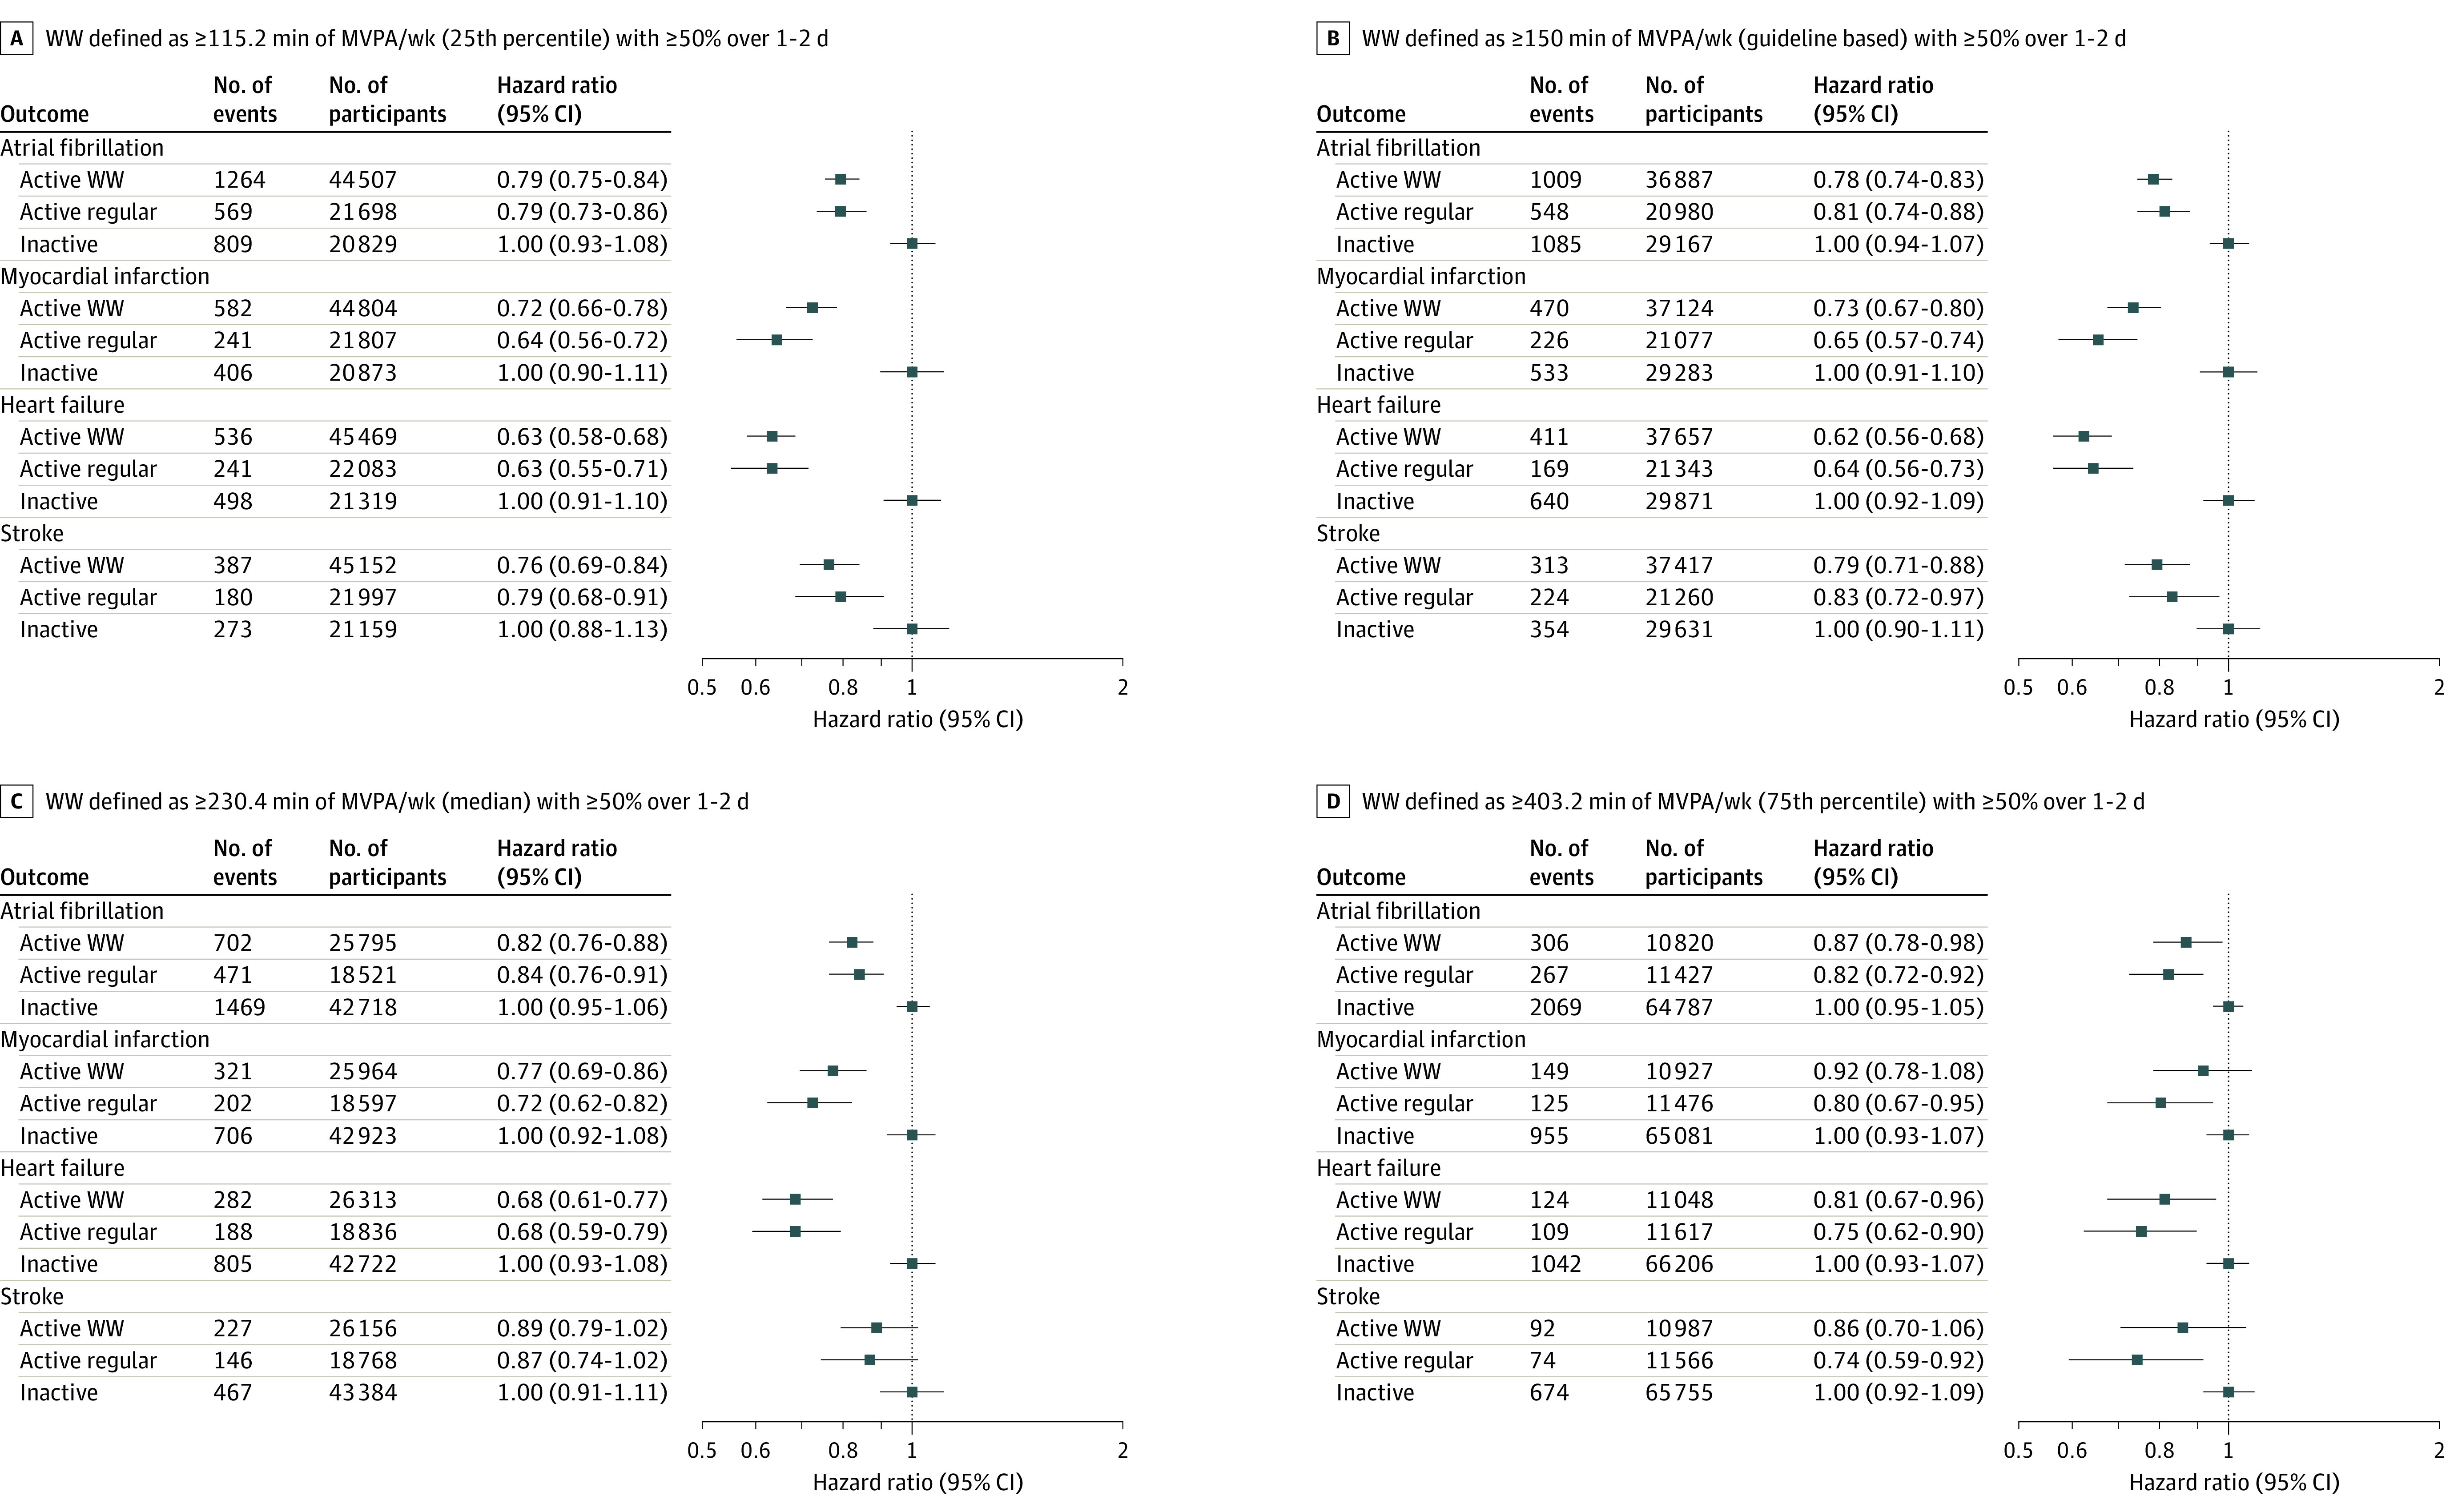
Figure 2. Associations Between Physical Activity Pattern and Incident Cardiovascular Disease.

Depicted are plots of multivariable-adjusted associations between activity pattern and incident atrial fibrillation, myocardial infarction, heart failure, and stroke. Three activity groups are compared: active weekend warrior (active WW), active regular, and inactive (reference). Each plot depicts a different activity threshold used to define the inactive group (see title above each plot). Bars depict 95% CIs.
