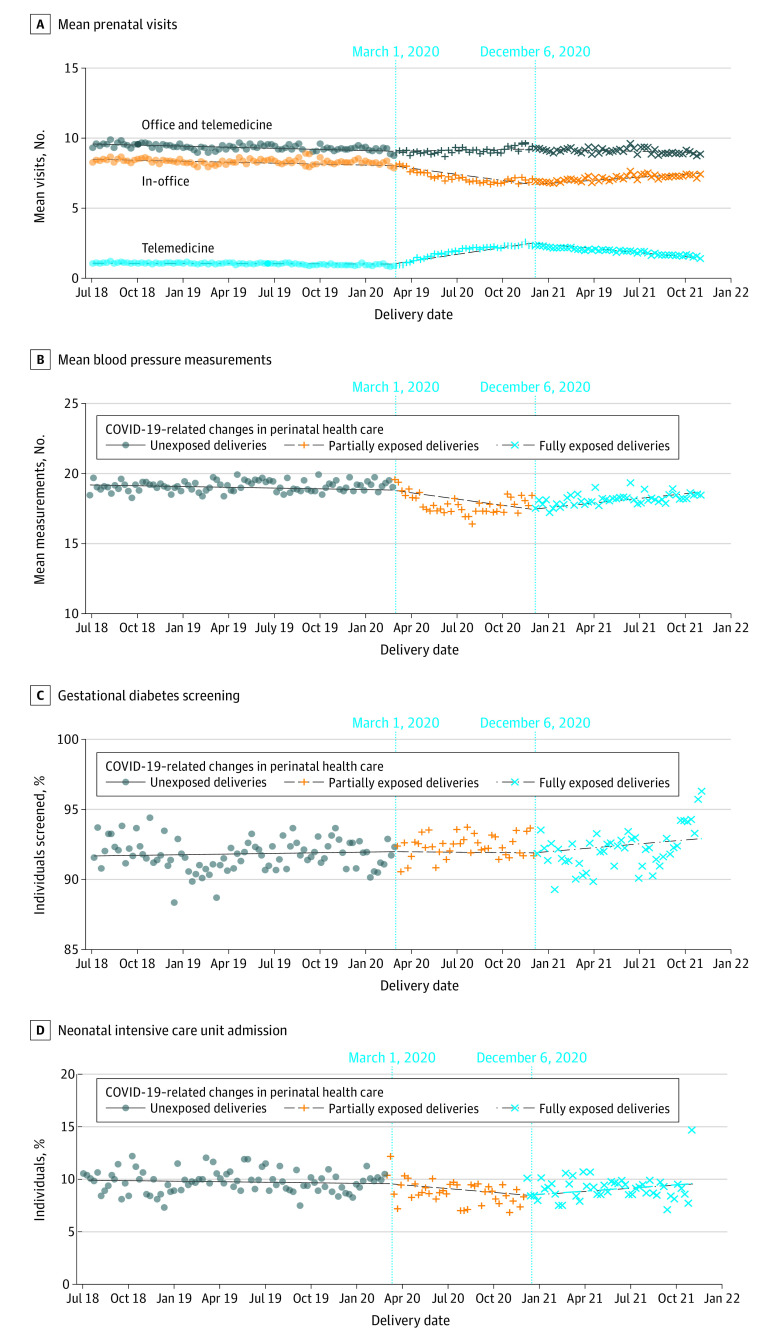
Figure 1. Association of Health Care Outcomes With Exposure to a Multimodal Prenatal Health Care Model During the COVID-19 Pandemic .
The figure shows mean prenatal visits per individual per week of birth delivery (A), mean blood pressure measurements per individual per week of birth delivery (B), the percentage of individuals screened for gestational diabetes per week of birth delivery (C), and rates of neonatal intensive care unit admission (D) among 151 464 individuals. Vertical lines indicate periods of exposure to the multimodal health care model. In the first period, individuals with birth delivery between July 1, 2018, and February 29, 2020, were unexposed to the model; in the second period, individuals with birth delivery between March 1, 2020, and December 5, 2020, were partially exposed to the model; and in the third period, individuals with birth delivery between December 6, 2020, and October 31, 2021, were fully exposed to the model.

