
FIGURE 2.
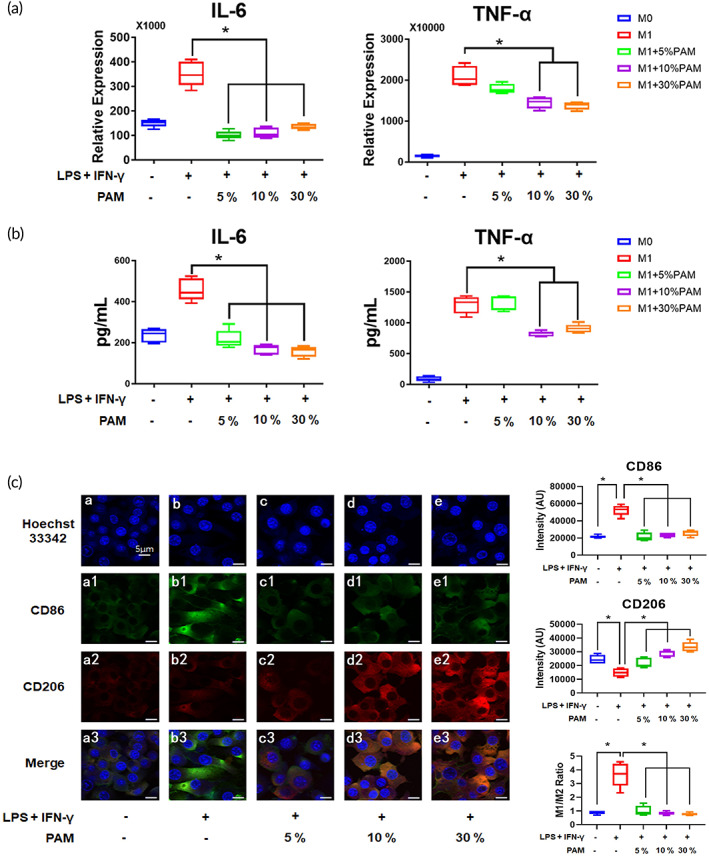
PAM reduced the expression of M1 markers in an inflammatory microenvironment and promoted M1 to M2 phenotypic shift of macrophages. (A) The gene expression levels of inflammatory macrophage markers after PAM treatment were displayed in a box plot graph. The data from five independent experiments were shown as mean ± SD (*p < 0.05, one‐way ANOVA); (B) the concentrations of inflammatory cytokines derived from PAM‐stimulated macrophages are shown. The results of five independent experiments are presented as mean ± SD (*p < 0.05, one‐way ANOVA); (C) the IF staining images show the change of M1/M2 ratio after PAM treatment (scale bars: 5 μm). Data from five randomly selected field of view (FOV) were analyzed using the ImageJ software to determine the intensity of CD86 and CD206. The results are presented as mean ± SD (*p < 0.05, one‐way ANOVA).