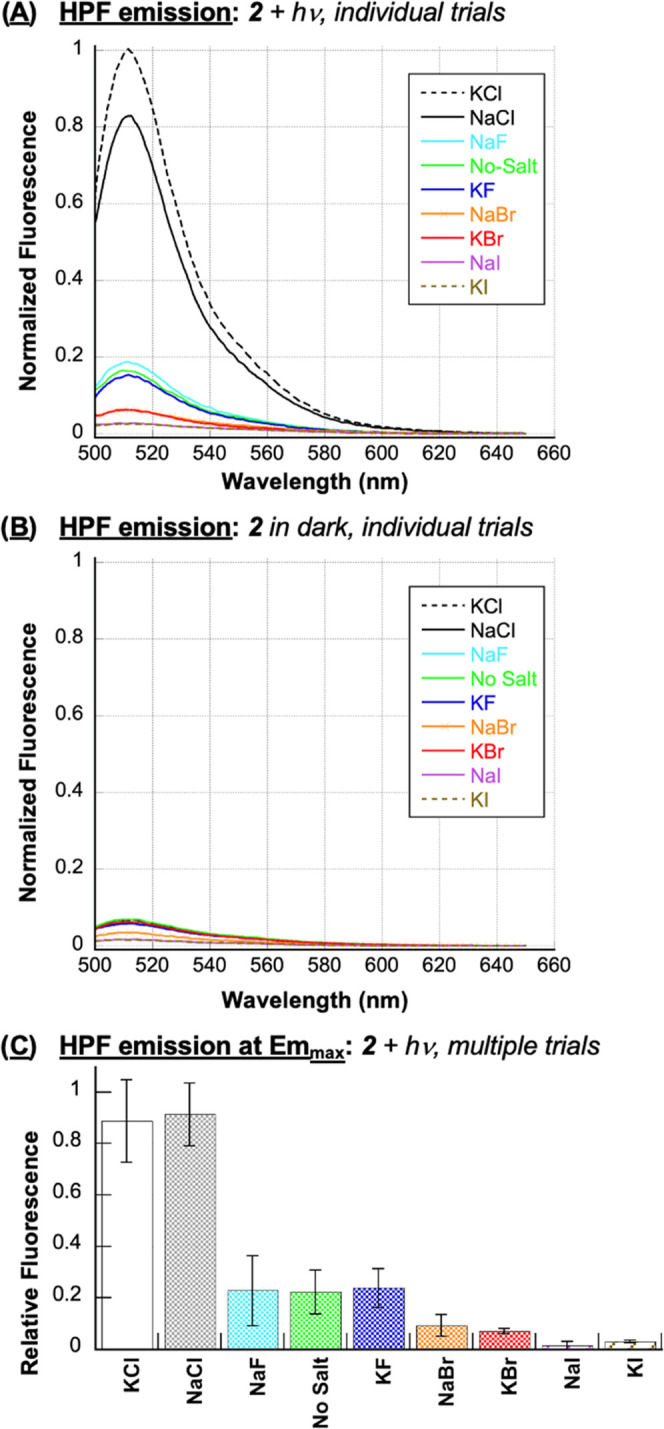
Figure 4.

Representative, normalized HPF emission spectra of runs in the (A) presence and (B) absence of 400 mM NaF, KF, NaCl, KCl, NaBr, KBr, NaI, or KI (no DNA). The samples, which consisted of 1 μM N1-(anthracen-9-ylmethyl)ethane-1,2-diaminium dichloride 2, 3 μM HPF, and 10 mM sodium phosphate buffer pH 7.0, were irradiated for 120 s in a ventilated Rayonet photochemical reactor fitted with 8 RPR-3500 Å, 24 W lamps. HPF emission spectra were then recorded from 500 to 650 nm at an excitation wavelength of 490 nm. (C) Normalized fluorescence emission at 511.5 nm from individual runs averaged over two to three trials. Error bars represent standard deviation.
