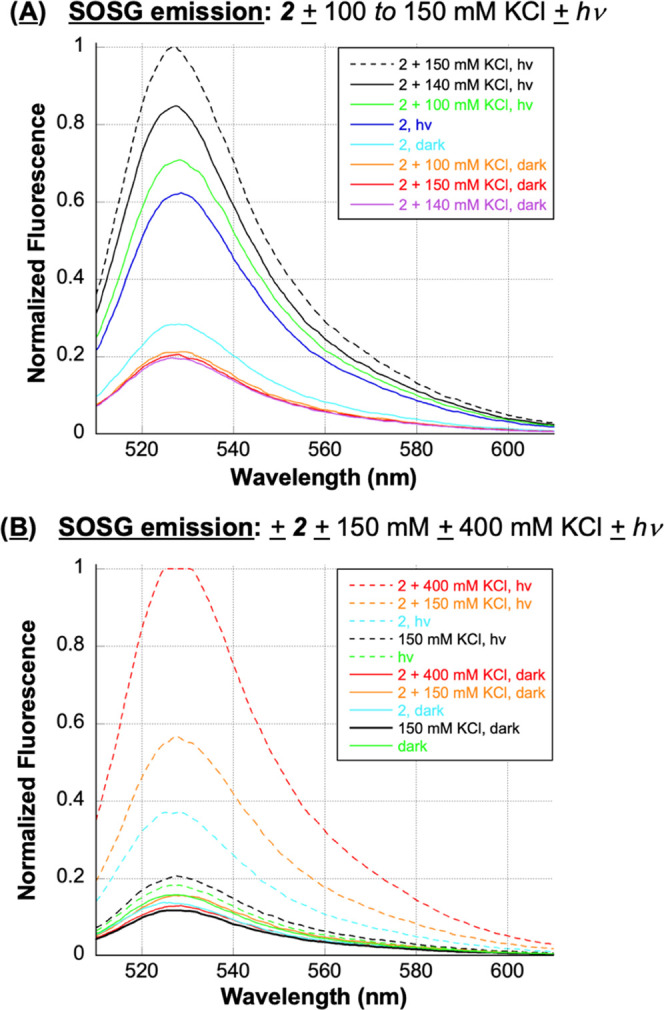
Figure 9.

SOSG (A) SOSG emission spectra of 1 μM SOSG, 1 μM 2, and 10 mM sodium phosphate buffer pH 7.0 in the presence and absence of 100, 140, and 150 mM KCl (no DNA). (B) Normalized SOSG emission spectra of 1 μM SOSG and 10 mM sodium phosphate buffer pH 7.0 in the presence and absence of 1 μM 2, 150 mM KCl, and 400 mM KCl (no DNA). (A, B) Samples were irradiated for 30 min at 350 nm or kept in the dark. SOSG emission spectra were then recorded from 510 to 650 nm at an excitation wavelength of 500 nm.
