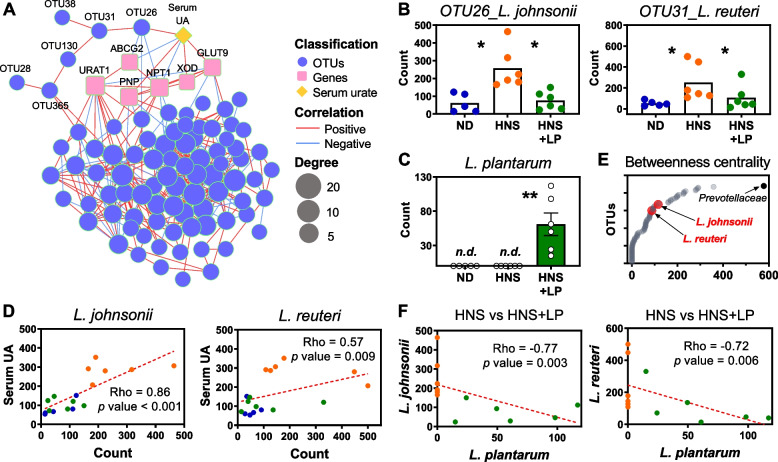
Fig. 2.
L. plantarum decreases L. johnsonii and L. reuteri in gut. A Multi-omic network integrating microbial abundances (blue circles) with serum urate level (yellow diamond) and gene expression of key genes (pink squares) involved in urate synthesis and excretion. Node size and green outline of nodes correspond to degree (number) that combined with other nodes. Red and blue edges represent positive and negative correlation, respectively, between two nodes. Edge (line) weight is proportional to correlation coefficient. Data are visible in Tables S9 and S10. B, C Abundance of two Lactobacillus species including L. johnsonii (left panel in B) and L. reuteri (right panel in B) and L. plantarum (C) in feces of mice fed ND, HNS, and HNS + LP. Graphs show the mean ± s.e.m. Each symbol represents a mouse, and n.d. means not detected. *P < 0.05, **P < 0.01 by one-tailed t-test. D Scatter plot for correlation analysis between ND (blue), HNS (orange), and HNS + LP mice (green). Dots indicate the abundance of microbe (X axis) versus serum urate level (Y axis). E Betweenness centrality responds to the importance for altering gut microbiota and urate metabolism. Every symbol represents one operational taxonomic unit (OTU). F Scatter plot for correlation analysis between HNS (orange) and HNS + LP mice (green). Dots indicate the abundance of L. plantarum versus other microbes. The dotted line shows the fitted line. Graphs show the Spearman rho correlation coefficient and p value

