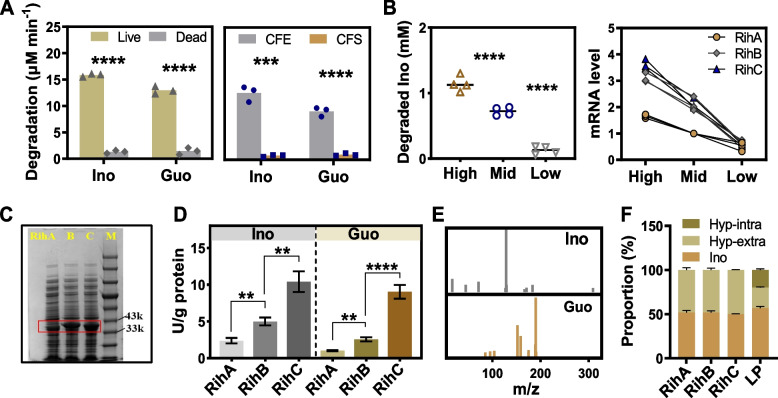
Fig. 3.
L. plantarum transforms exogenous nucleoside into nucleobase. A Degradation rate of inosine (Ino) and guanosine (Guo) by live or dead L. plantarum (left panel), by intracellular cell-free extract (CFE) or cell-free supernatant (CFS) of L. plantarum (right panel). B Degradation ability of live L. plantarum (left panel) and mRNA levels (right panel) of key enzymes RihA, RihB, and RihC after administration of different amounts of inosine (concentration of 1.14 ± 0.12 mM (High), 0.72 ± 0.06 mM (Middle), and 0.13 ± 0.06 mM (Low)). C SDS-PAGE showed the molecular weight of recombinant enzyme Rih A–C in E. coli BL21 (DE3) after induced expression. M refers to marker. D Enzymatic activity of recombinant RihA, RihB, and RihC towards hydrolysis of inosine and guanosine. E Mass spectra confirmed the degradation product of inosine and guanosine to be hypoxanthine and guanine, respectively. F Proportion of substrate inosine and product hypoxanthine after 1 h reaction catalyzed by Rih A–C and live L. plantarum. Hyp-intra and hyp-extra refers hypoxanthine (Hyp) detected intracellularly and extracellularly, respectively. Graphs show the mean (A, B) and mean ± s.d. (D, F). Each data point represents three independent biological replicates (A, B). Data was analyzed by two-tailed t-test (A, D) and one-way ANOVA with t-test correction (B). **P < 0.01, ***P < 0.001, ****P < 0.0001

