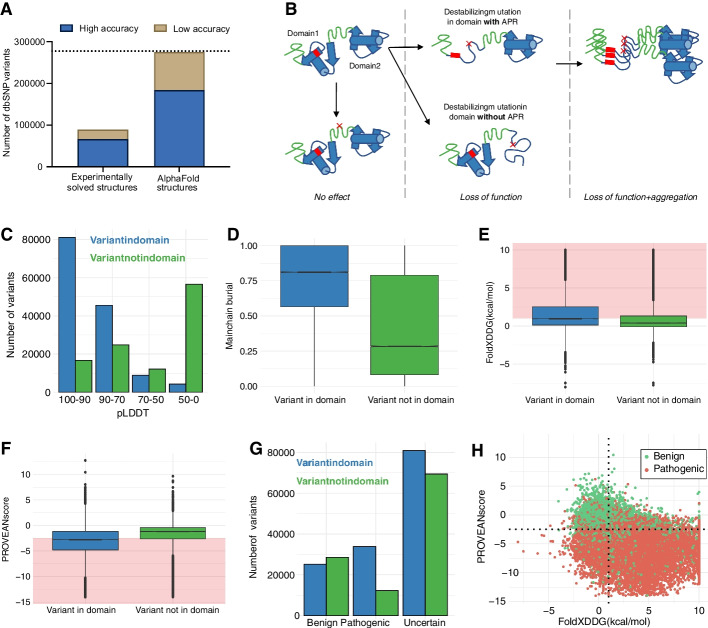
Fig. 2.
SNPeffect analysis of variants in dbSNP. A Number of dbSNP variants that are mapped to a human experimentally solved structure (from PDB) or to an AlphaFold model. High accuracy refers to experimentally solved structures or AlphaFold models with a resolution < 3 Å or a pLDDT score > = 70, respectively. Dotted line indicates the total number of missense variants analyzed. B Schematic overview of how mutations can affect a protein based on the context of their structural domains. C Number of variants in dbSNP mapped to AlphaFold structures in each pLDDT category. Stability predictions on variants that are in regions with low pLDDT scores (< 70) should be treated with caution. D Boxplot showing the mainchain burial of variants in dbSNP. E Boxplot of the free-energy change upon mutation (ΔΔG) of dbSNP variants. A ΔΔG > 1 is considered destabilizing for the structure. F Boxplot of the pathogenicity impact calculated by PROVEAN upon mutation for dbSNP variants. A PROVEAN score < − 2.5 indicates that the mutation is pathogenic. G Number of dbSNP variants in the context of their defined clinical outcome. Variants that are within domains tend to be more pathogenic than variants that are outside domains. H Relation of FoldX values and PROVEAN scores. The vertical and horizontal lines represent the FoldX and PROVEAN thresholds for identifying destabilizing or pathogenic variants, respectively

