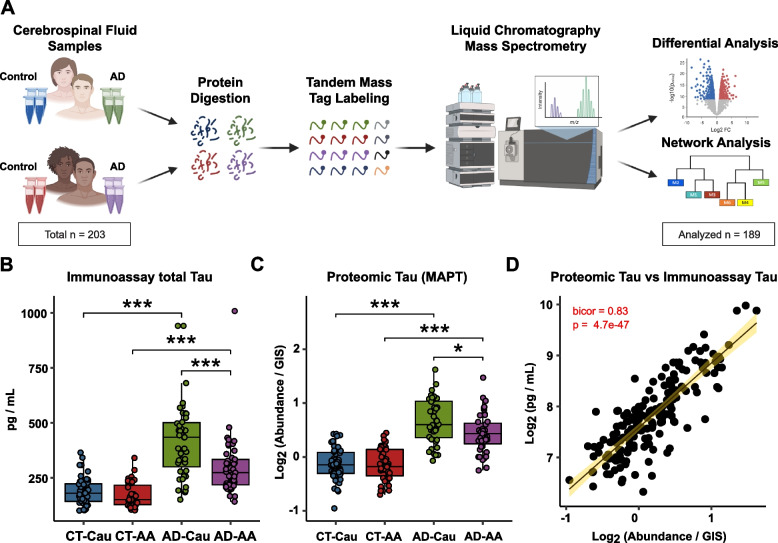
Fig. 1.
Schematic of experimental workflow and correlation between proteomic Tau and total Tau immunoassay measurements. A Schematic of experimental workflow for quantification of cerebrospinal fluid proteome. B Total Tau levels as measured by Roche Elecsys Platform between control (CT) and AD cases and stratified by self-identified race: Caucasian (Cau) or African American (AA) C Tau levels measured by mass spectrometry. One-way ANOVA with Tukey post-hoc correction determined pairwise relationships D Correlation of Tau levels by TMT-MS (x-axis) to paired immunoassay total Tau levels (y-axis). Biweight midcorrelation coefficient (bicor) with associated p-value is shown. Only 179 cases were included in the linear regression analysis because of sample outlier removal and missing values in the TMT-MS

