Fig. 2.
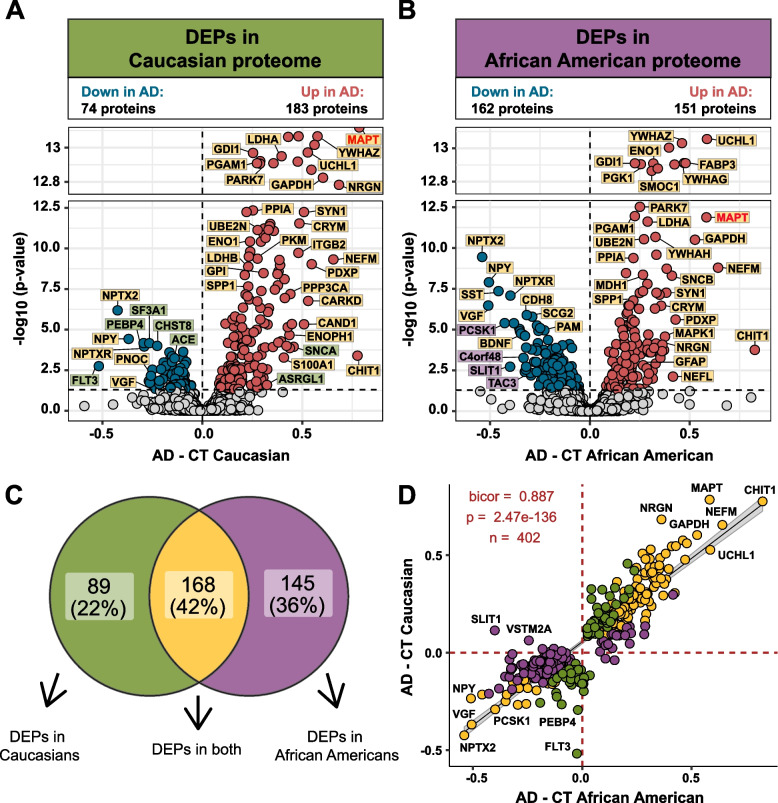
Differential expression of Caucasian and African American CSF proteomes in AD. Volcano plot displaying the log2 fold change (FC) (x-axis) against one-way ANOVA with Tukey correction derived -log10 p-value (y-axis) for all proteins (n = 1840) comparing AD versus controls for Caucasians A and African Americans B. Cutoffs were determined by significant differential expression (p < 0.05) between control (CT) and AD cases. Proteins with significantly decreased levels in AD are shown in blue while proteins with significantly increased levels in disease were indicated in red. Select proteins were denoted and labeled by whether they were differentially expressed in both proteomes (yellow), in only the Caucasian proteome (green), or in only the African American proteome (purple). C Venn diagram illustrating the number of differentially expressed proteins (DEPs) that were uniquely changed in one proteome (green or purple) or changed in both proteomes (yellow) D The correlation between the fold change of all DEPs (n = 402) across the African American proteome (x-axis) and the Caucasian proteome (y-axis) were strongly correlated (bicor = 0.887, p = 2.47e-136), regardless of whether the DEP was significant in one (green or purple) or both proteomes (yellow)

