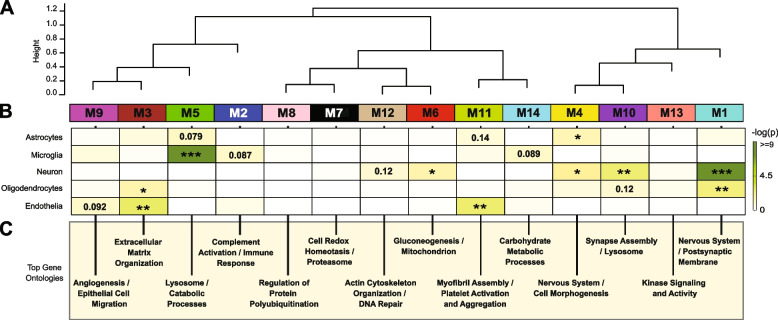
Fig. 3.
Network analysis classifies the CSF proteome into modules associated with specific brain cell-types and gene ontologies. A Weighted Gene Co-expression Network Analysis cluster dendrogram groups proteins (n = 1840) into 14 distinct protein modules (M1-M14). B Cell-type enrichment was assessed by cross referencing module proteins by matching gene symbols using a one-tailed Fisher’s exact test against a list of proteins determined to be enriched in neurons, oligodendrocytes, astrocytes, microglia and endothelia. The degree of cell-type enrichment increases from yellow to dark green with asterisks denoting the following statistical significance (*p ≤ 0.05; **p ≤ 0.01; ***p ≤ .001). C Top gene ontology (GO) terms were selected from significant GO annotations

