Fig. 2.
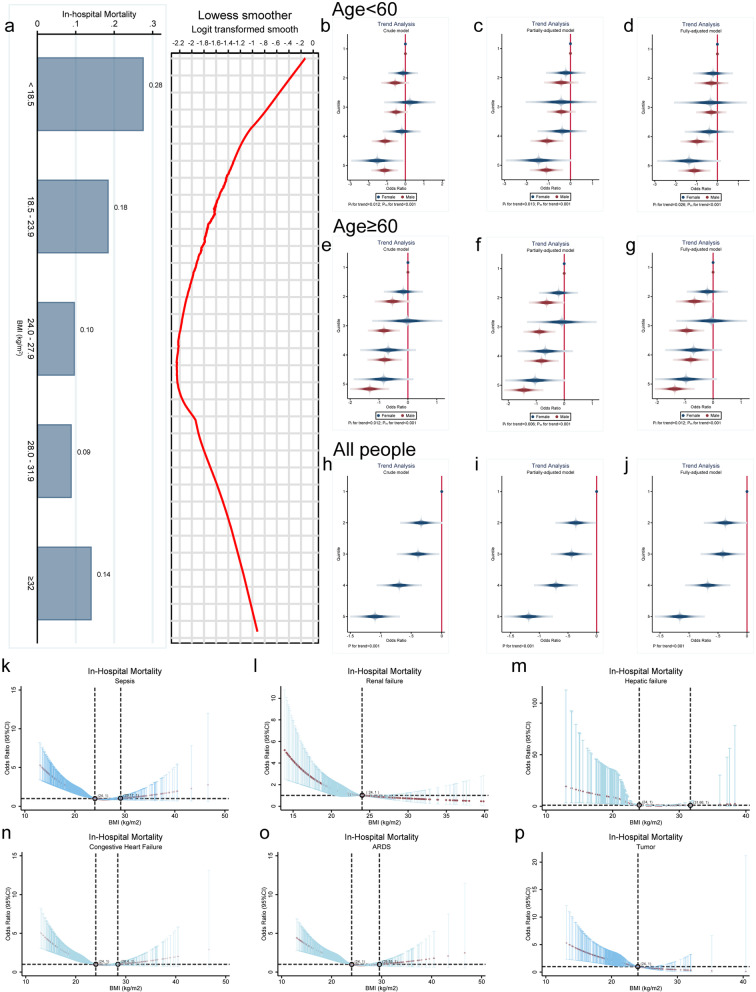
Exploratory analysis of the correlation between BMI levels and in-hospital mortality. a The LOWESS curve indicated a non-linear association between BMI and in-hospital mortality, approximating a U-shaped curve. b–j Quintiles categorized by BMI levels were utilized to calculate ORs for different age and gender groups. Males were represented by red, while females were represented by blue. The OR value for the confounders were adjusted asymptotically for crude, partial (SOFA, PaCO2, Lac, AST, BUN), and full (aCCI, SOFA, MAP, Fio2, PaCO2, PaO2, WBC, PLT, Lac, APTT, Urine, ALT, AST, BUN, Cr), as demonstrated in Table 2. Trend testing was conducted using P-values. The association between BMI and hospital mortality across Various Comorbidities. Note: BMI was divided into 5 groups based on quintiles (< 19.48, 19.49-20.76, 20.77-21.81, 21.82-24.15, >24.16, kg/m2). k–p Association of BMI with in-hospital mortality in subgroups with different co-morbidities (all P < 0.01)

