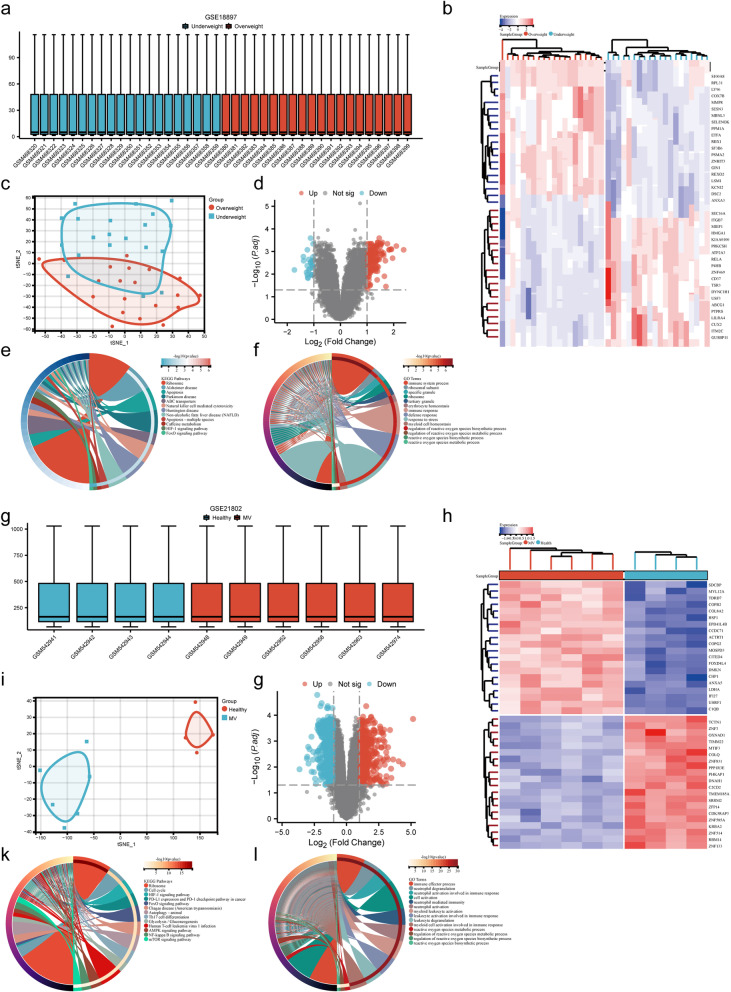
Fig. 4.
Results of the gene expression analysis for GSE18897 and GSE21802. a A box plot of normalized gene expression for the GSE18897 dataset. b A heatmap of DEGs. c A t-SNE plot. d A volcano plot of DEGs. e KEGG enrichment analysis of intersection genes. f GO enrichment analysis of intersected genes. g A box plot of normalized gene expression for the GSE21802 dataset. h A heatmap of DEGs. i A t-SNE plot. j A volcano plot of differentially expressed genes. k The KEGG enrichment analysis of intersection genes. l The GO enrichment analysis of intersected genes

