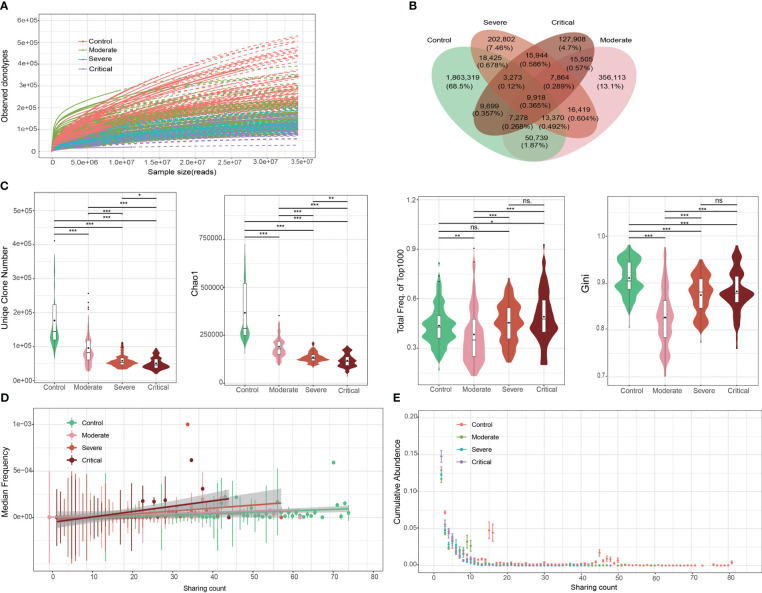
Figure 2.
Overall characteristics of the T cell receptor (TCR) β repertoires in patients with COVID-19 and healthy controls (HCs). (A) Saturation analysis of each group. Sequencing data were randomly selected to determine the number of clonotypes detected and extrapolated to the size of the largest samples. Solid and dashed lines represent the interpolated and extrapolated regions of the rarefaction curves, respectively, and points indicate the exact sample size and diversity. (B) Overlap between each group of public clones. (C) Obvious clonal expansion from the aspects of TCR β repertoire diversity in COVID-19 development. Horizontal line is the median, and dot is the average value in the boxplot. (D) Trend of changes in the average abundance of clones under different detection sample numbers for each group. (E) Trend of changes between the total abundance of clones under different detection sample numbers for each group. ***P ≤ 0.001, **P ≤ 0.01, *P ≤ 0.05. ns = no significance.

