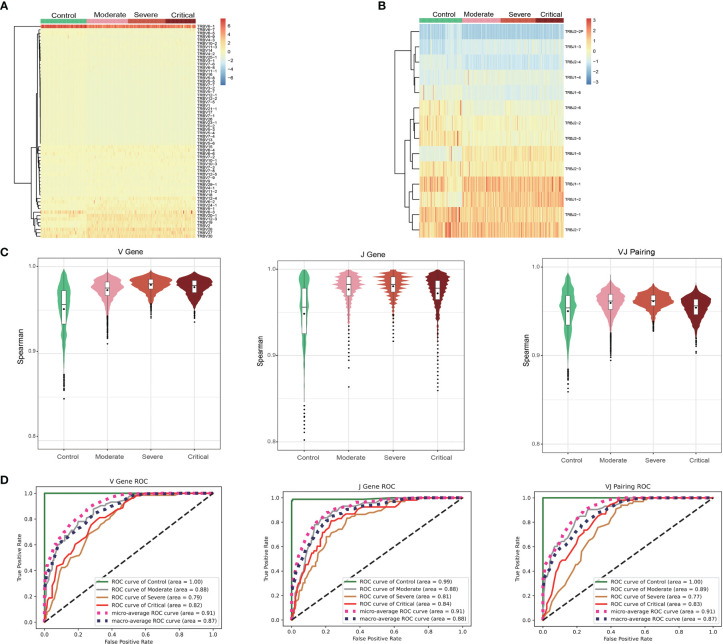
Figure 3.
Gene usage analysis of the T cell receptor (TCR) β repertoires. Frequency of V gene (A) and J gene (B) usage in different samples. (C) Frequency of the similar patterns of V gene, J gene, and VJ pairing in different groups. (D) ROC curves showing the performance of the classification into four groups using the V gene, J gene, and VJ pairing via 10-fold cross-validation.

