Figure S2.
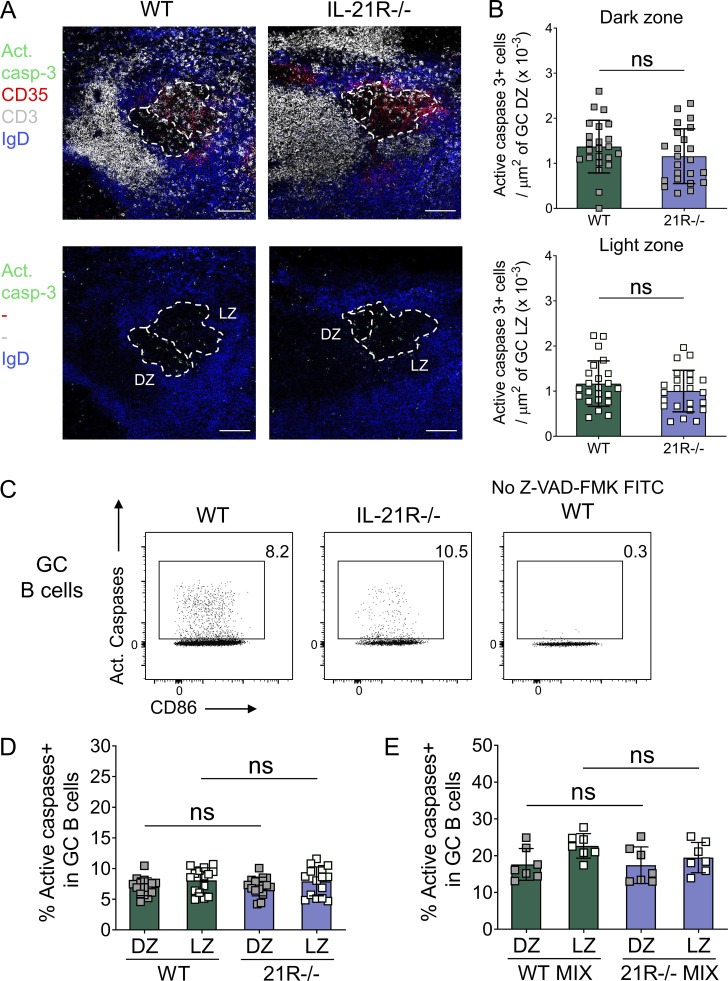
GC B cells from SRBC-immunized wild-type and IL-21R−/− mice show comparable caspase activity. (A and B) Density of apoptotic cells was analyzed in splenic GC from SRBC-immunized wild-type (WT) and IL-21R−/− mice 6 d after immunization. Spleen sections were stained for active caspase-3 (green), CD35 (red), CD3 (white), and IgD (blue). (A) Representative confocal images of splenic GC and (B) collated data comparing active caspase-3+ cell density in GC dark zone (DZ; CD35−; top) and light zone (LZ; CD35+; bottom). Scale bar 100 µm; 7–9 GC/mouse, each point represents a GC. Data are collated from two independent experiments; n = 3; Mann–Whitney U test. (C and D) Ex vivo, active caspases were detected using FITC-tagged active pan-caspase inhibitor Z-VAD-FMK. (C) Representative flow cytometry plots for caspase activity in GC B cells (live CD19+Fas+GL-7+) and (D) collated data for caspase activity in GC B cells subdivided into dark zone (CXCR4highCD86low) and light zone (CXCR4lowCD86high) compartments. Data are collated from four independent experiments; n = 15; Kruskal–Wallis test. (E) WT and IL-21R−/− mixed bone marrow chimeric mice were immunized with SRBC and their spleens were analyzed 6 d later. Collated data for caspase activity in GC B cells subdivided into dark zone and light zone compartments. Data are collated from two independent experiments; n = 7; Wilcoxon matched-pairs signed rank test. Mean ± SD are shown; ns, not significant.

