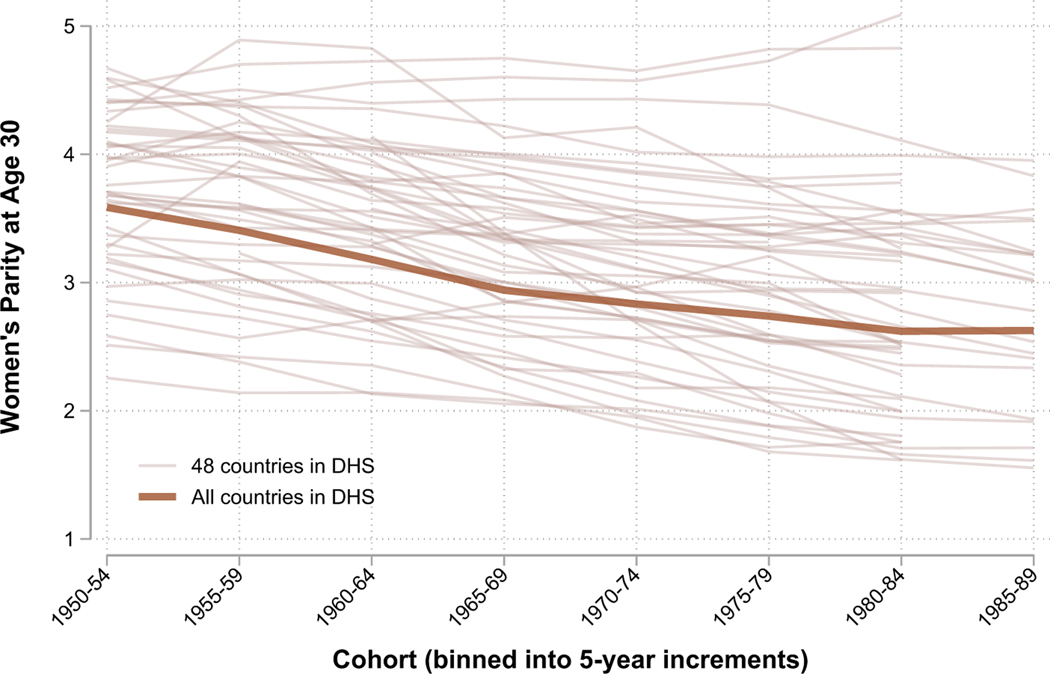
Fig. 1.
Women’s parity at age 30, by birth cohort, for 48 countries. The horizontal axis is cohort (year of birth) binned into five-year increments from 1950 to 1989; the vertical axis is the average parity at age 30 of women in that cohort bin. Each thin line represents a different country; the thick line represents the average across countries. Source: Demographic and Health Surveys.

