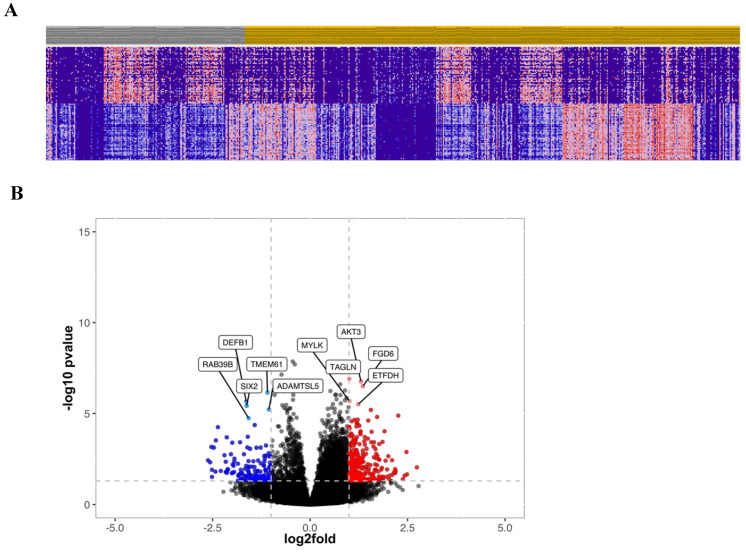
Figure 3.
(A) Hierarchical clustering of the top 50 most differentially expressed genes between low (Grey) and high (Amber) S100A2 protein expression. (B) Volcano plot showing the distribution of gene expression fold changes and p values between patients with high and low S100A2; Red means up-regulated in cases with low S100A2 and blue means up-regulated in cases with high S100A2.

