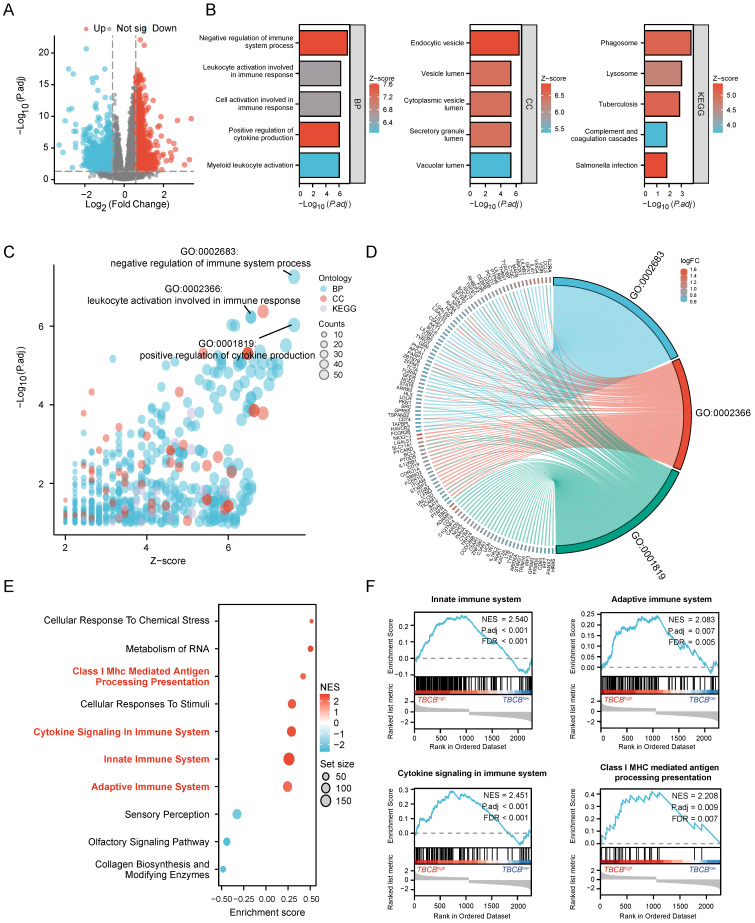
Figure 3.
DEGs and their functional pathways enrichment analysis. (A) Volcano plot showing TBCB-related DEGs, |log2FC| ≥ 0.59, p-adjust< 0.05. (B) The bar diagrams display the top five terms for each GO category and KEGG analysis of the up-regulated DEGs, including biological processes (left), cellular components (medium), and KEGG pathways (right). (C-D) Bubble plot (C) and chord plot (D) showing the top 3 BP terms. (E) The first 10 gene sets of GSEA analysis using the Reactome of C2 in MSigDB database. Immune-related gene sets were marked with red. (F) GSEA analysis of immune-related gene sets in up-regulated DEGs.

